Year 2019 comes soon, now it’s time to review the whole year 2018. This year I learn and focus on a programming language other than R, Python. Thus, projects that mentioned in this blog are almost realised by Python. In the following, I’ll talk about:
- Working in retailing
- Self-learning
- Blog
- Personal project
Working in retailing
(All sensitive data in this part is either simulated or hidden by mosaic.)
Reporting industrialization
Last year we used a data integration software and accomplished reporting automatization with interface, but this kind of manipulation cannot satisfy our needs. So this year we have an important revolution on reporting industrialization: realising ETL by python and industrializing by gitlab runner. And of course, we converted all lagacy job-processes to this new approach.
Thanks to this revolution, I got how to connect to teradata database and SQL
Server by python, had a better and clearer understanding of numpy and pandas’s
manipulation, generated and formatted excel worksheets by openpyxl,
visualized data with suitable graphs, sent reports/alerts by e-mail, and the
last one, which is also the most valuable step, autorise all steps mentioned
before by gitlab runner.
Self-learning
Like I mentionned at the begining of this blog, this year I focus on Python
programming, for both professional projects and self-learning. In this way, I
can consolidate self-learning knowledge during working, and can also advance
my professional projects with the knowledge that I learnt after working. This
year I learnt with a new approach instead of online courses, I learnt by
reading book and writing unit test in python for ensuring my
understanding of numpy, pandas and data manipulation like groupby,
aggregation, data wrangling and time series.
Moreover, mastering data manipulation methods is not enough, visualization can
alive the data. So I learnt how to make graphs with matplotlib.
Considering different plots are suitable for differents situations, I explored
their use cases and wrote my first blog series, Matplotlib series.
| Plot type | Use cases |
|---|---|
| Bar chart | Compare categorical data. Comparisons among discrete categories. |
| Line chart | Track changes over time. X-axis displays continuous variables. Y-axis displays measurement |
| Pie chart | Show percentage or proportional data. Display data that is classified into nominal or ordinal categories. |
| Scatter plot | Show the relationship between two variables |
| Treemap | Less than 10 branches. Positive values. Space for visualisation is limited. |
| Venn diagram | Show logical relations between different groups (intersection, difference, union). |
| Area chart | Show or compare a quantitative progression over time. |
| Radar chart | Comparing two or more items or groups on various features or characteristics. Examining the relative values for a single data point. |
| Word cloud | Depicting keyword metadata (tags) on websites. Delighting and provide emotional connection. |
| Lollipop plot | Showing the relationship between a numerical variable and another numerical or categorical variable. |
| Histogram | Estimating the probability distribution of a continuous variable (quantitative variable). Organizing large amounts of data, and producing a visualization quickly, using a single dimension. |
Blog
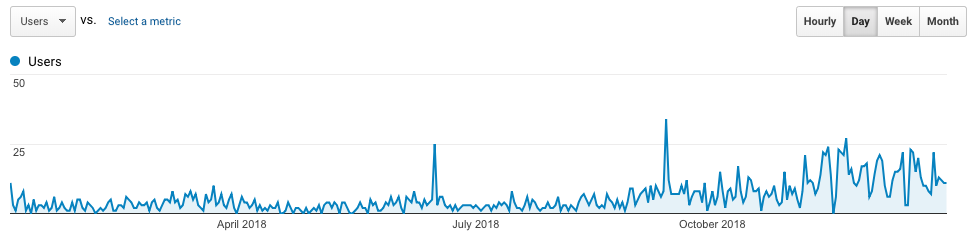
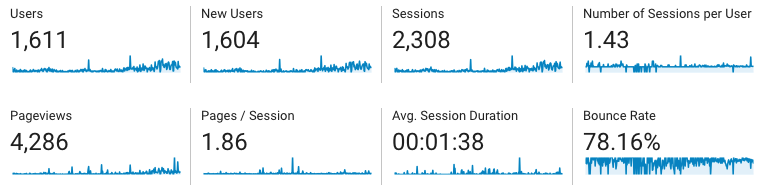
Thanks to you, my blog’s traffic increases 102% with respect to 2017. 20 new
blogs are written, for R, python, matplotlib, openpyxl,
gitlab runner, regular expression and
PEP 328. I’m pretty glad if my blogs can help you and solve
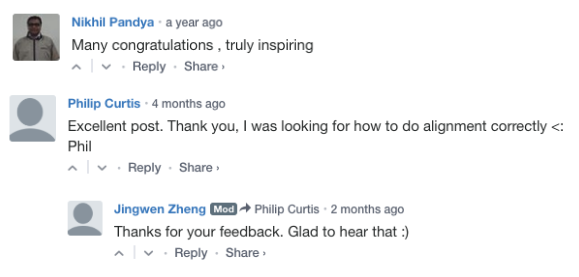
the problem for you. Some of you wrote me a feedback that I really appreciate.
In the next year, I plan to write some blogs about machine learning algorithm and try to improve UI of my blog, since the color combination is not that pretty ;p
Personal project
My husband and I create a small application which can help us to understand and to use reasonably personal finance. For this moment, it’s realised on python and google sheet. If you interest in detail, you can find it here.
Don’t hesitate if you want to ask a queston or write a comment, it’s welcome!!
Happy New Year! Hope to see you in 2019!