Paris is the capital and most populous city of France. Since the 17th century,
Paris has been one of Europe’s major centers of finance, diplomacy, commerce,
fashion, science, and the arts. According to the Economist Intelligence Unit
Worldwide Cost of Living Survey in 2018, Paris was the second most expensive
city in the world, after Singapore, and ahead of Zürich, Hong Kong, Oslo and
Geneva. Another source ranked Paris as the most expensive, on a par with
Singapore and Hong Kong, in 2018. All these elements help to bring the
increasing price of real estate in Paris. In this blog, I’ll talk about the
second-hand apartments purchases in Paris between January 2014 and June 2021,
with the following points:
- Data description
- How large are the apartments?
- Which is the most expensive arrondissement?
- Relationship between area & apartment price?
- Price evolution in terms of timing?
Data description
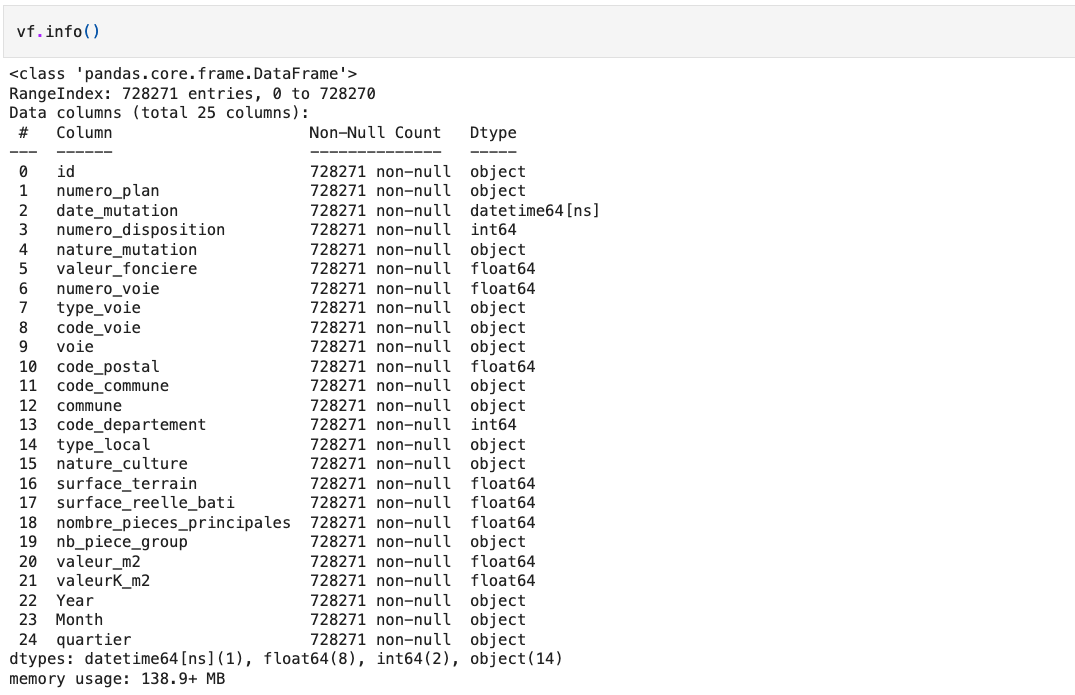
First of all, I downloaded real estate transactions’ data on the site of
government. In the dataset, we have transaction’s information
from January 2014 to June 2021, like “nature_mutation” specifies the sale’s
nature, “nombre_pieces_principales” indicates the number of rooms,
“valeur_fonciere” presents the sold price, “code_commune”, “nom_commune” and
“code_departement” specify the communities and departments, “surface_reelle_bati”
describes the real surface area.
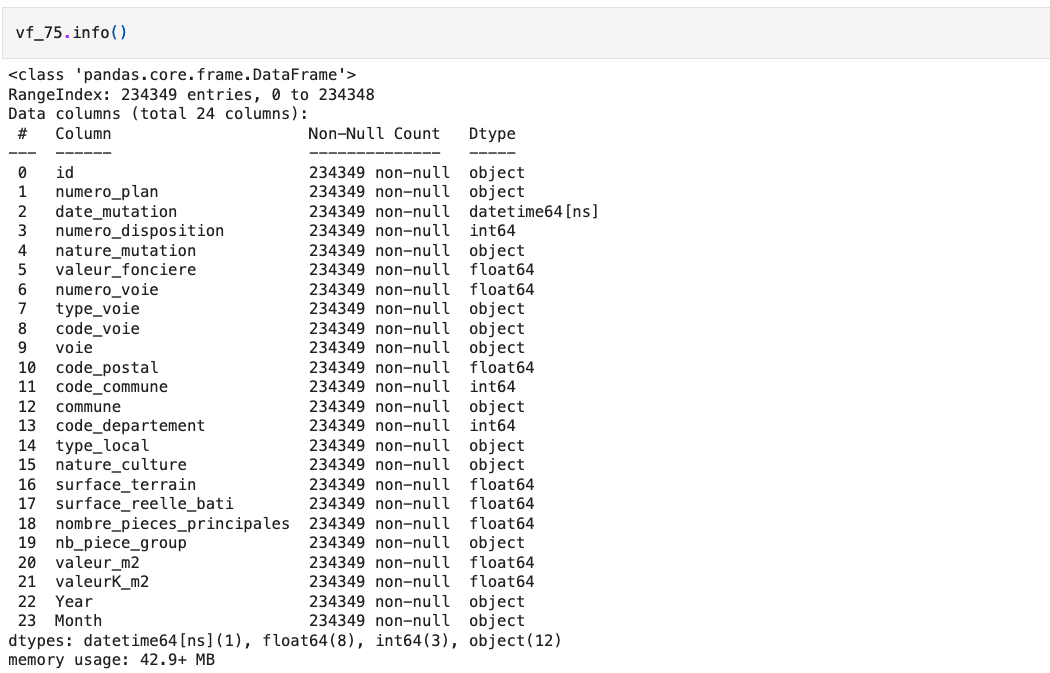
For this analysis, I only took account of second-hand apartments’ transactions
with a positive area in Paris.
How large are the apartments?
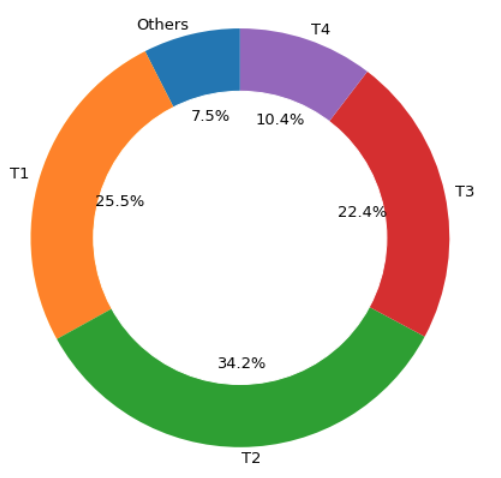
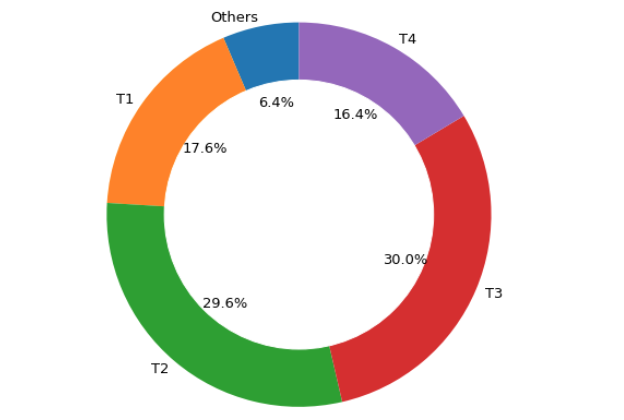
I classed second-hand apartments into 5 groups in terms of piece’s number: T1,
which means one-room apartment with around 23 m2; T2, which means two-room
apartment with around 40 m2; T3 presents three-room apartment around 63 m2; T4
are four-room apartments nearly 93 m2; T5 are five-room apartments with a larger
area of about 147 m2. This donut chart describes the quote-part of different
pieces’ apartments among the transactions. T1 and T2 hold 60% transactions, 22%
transactions sold T3 apartments, other purchases are for larger apartments.
Let’s go further on the details.
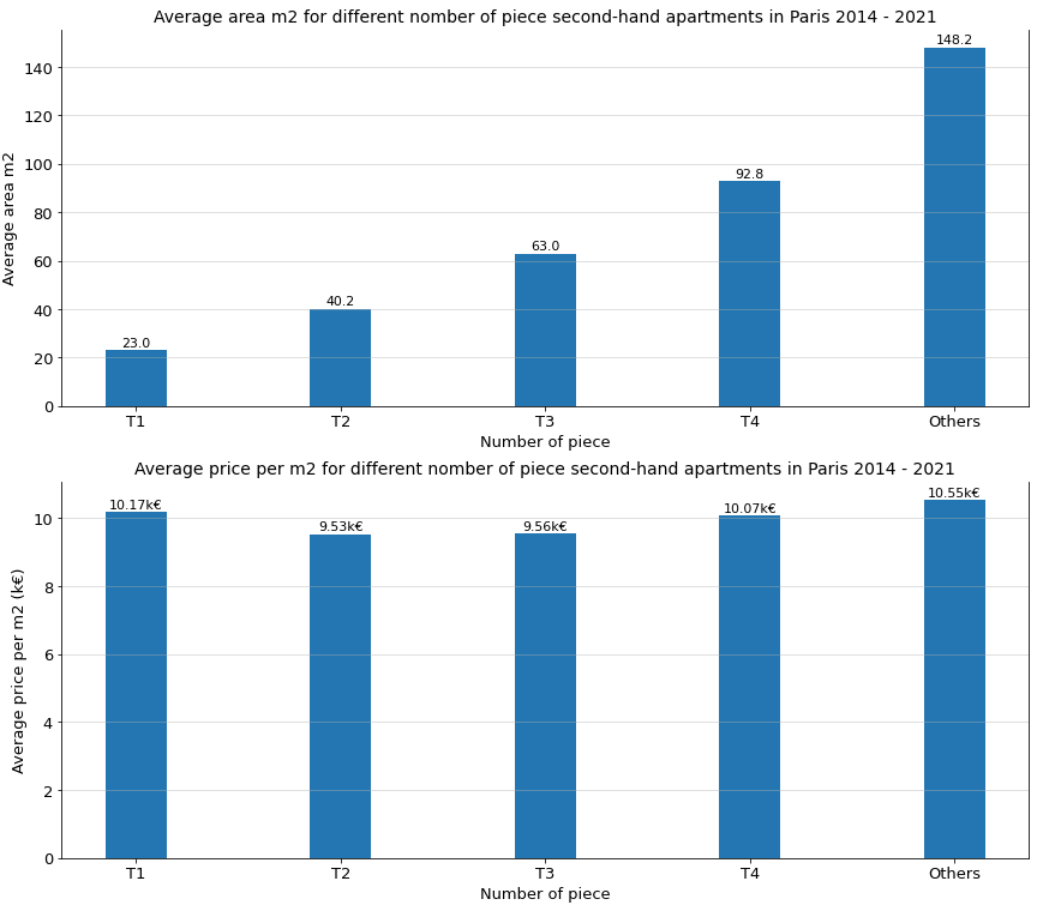
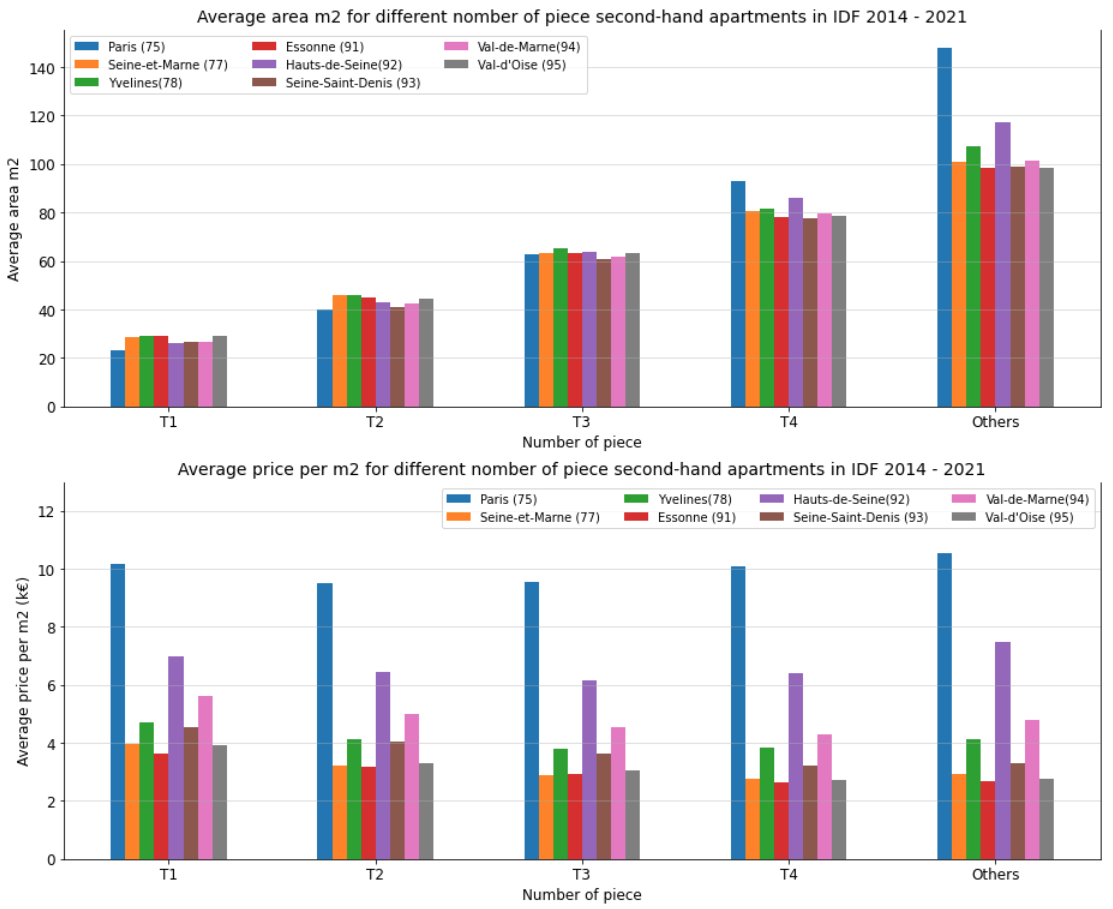
This graph describes the average price m2 for the different number of piece
second-hand apartments in Paris, between January 2014 and June 2021. According
to the second graph, we find that although T2 and T3 are much larger than T1,
their unit prices are 6.7% and 6.4% lower than the unit price of T1. Moreover,
the average area of T4 is three times larger than T1, its unit price is only 4%
more expensive than T1; similar for other piece-number apartments. Why are T1
apartments that expensive per m2? That might be because there are many students
or young workers in Paris, they need to rent a big enough apartment, which makes
investors invest in T1 apartments, which also leads to higher demands on T1.
Which is the most expensive arrondissement?
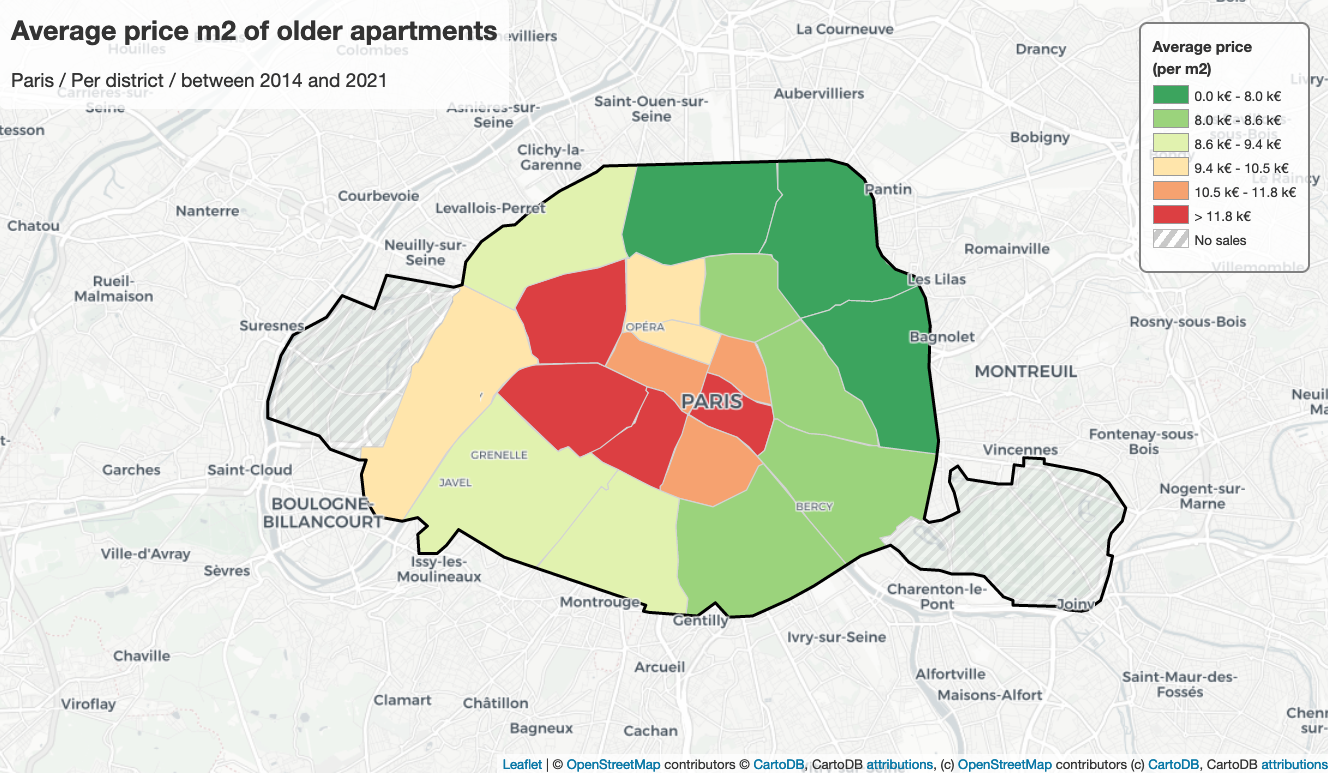
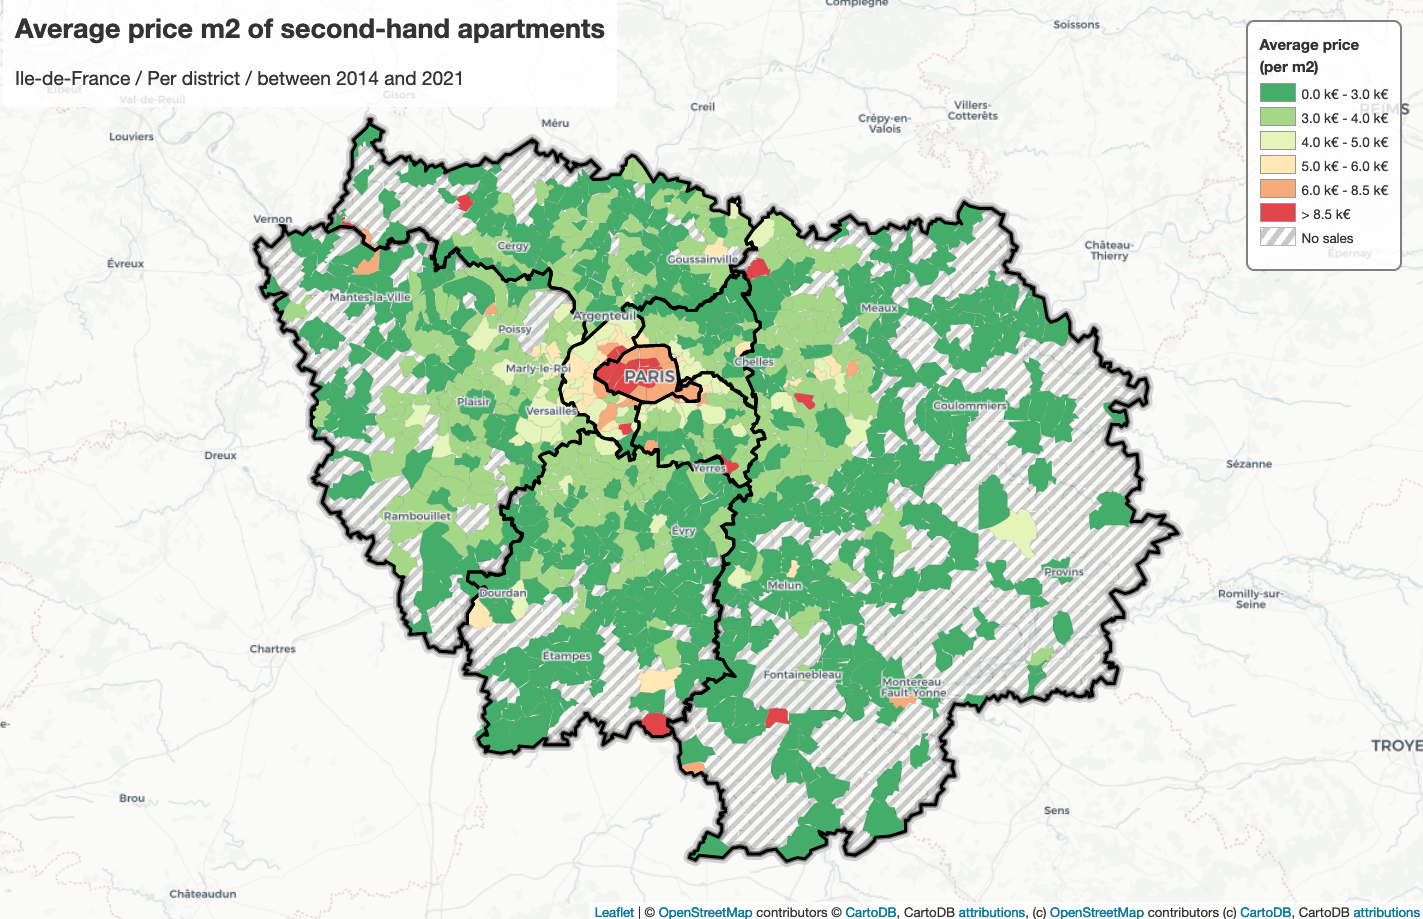
According to this map, we observe that the second-hand apartments in
arrondissements 4, 6, 7, 8 are much more expensive than other arrondissements,
their average unit price is at least 11800 euros; on the contrary, the
second-hand apartments in arrondissements 18, 19 and 20 are much cheaper than
others, their average unit price is less than 8000 euros. This might be caused
by geographical positions, number of pieces, apartment’s state, the performance
of energy, public security, etc. The public transport in the city center is more
than in other areas, there are also lots of shopping centers or tourist spots,
which attracts plenty of people, so that makes the city center to be more
valuable.
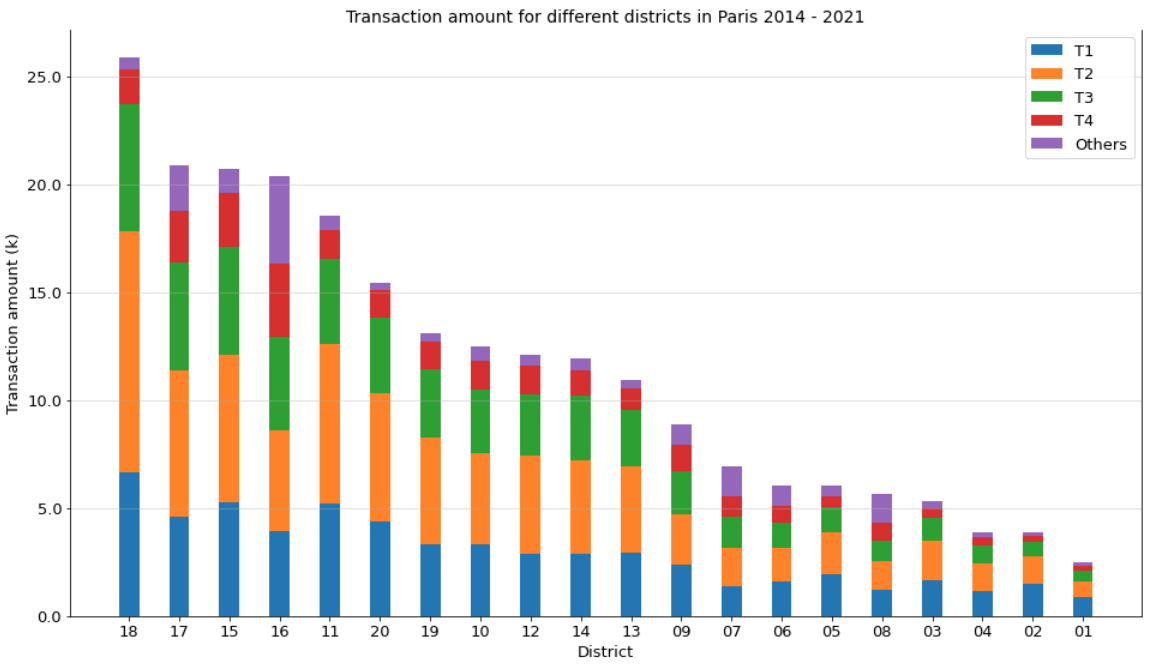
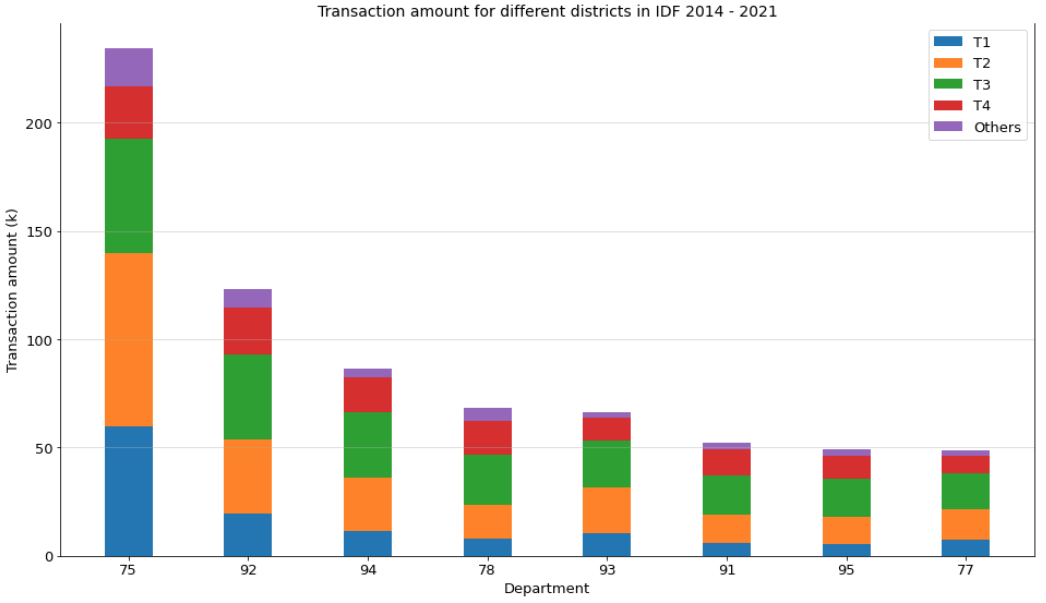
Furthermore, according to the stacked bar plot below, it’s obvious that there
are much more transactions in the 18th arrondissement than in other areas, nearly
50% sold apartments are 2-room apartments. The Sacré-Cœur Basilica and Montmartre
make the 18th arrondissement famous. A real neighborhood of artists, it is
bohemian and cosmopolitan. If you like discovering atypical places and diverse
personalities, you will find what you’re looking for. You will discover the
popular flea market, many schools and many nightlife venues, such as cabarets
around Pigalle. All these attract couples to live in the 18th arrondissement.
Moreover, in the 16th arrondissement, the transaction amount of T4 is pretty
larger than all other arrondissements. Paris 16 is eminently residential, as
evidenced by its charming buildings with green courtyards and balconies. But it
is also a Parisian cultural hotspot with many museums and emblematic places from
both a historical and intellectual point of view. Moreover, it concentrates many
schools and establishments of choice for the education of children and students.
All these might be the reason why the transactions of T4 in Paris 16 are much
more than other arrondissements.
For the arrondissements as 1st, 2nd or 3rd arrondissement, more than one third
of sold apartments are T1 apartments, that might be because there is not that
many apartments at the center of Paris, and its unit price is high.
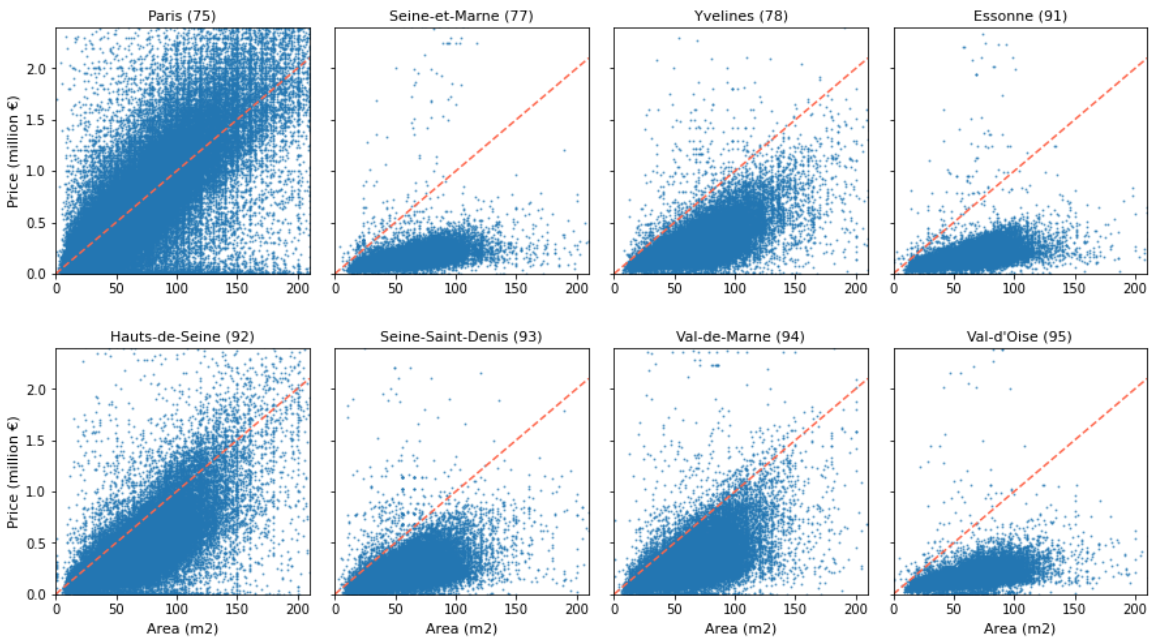
Relationship between area & apartment price?
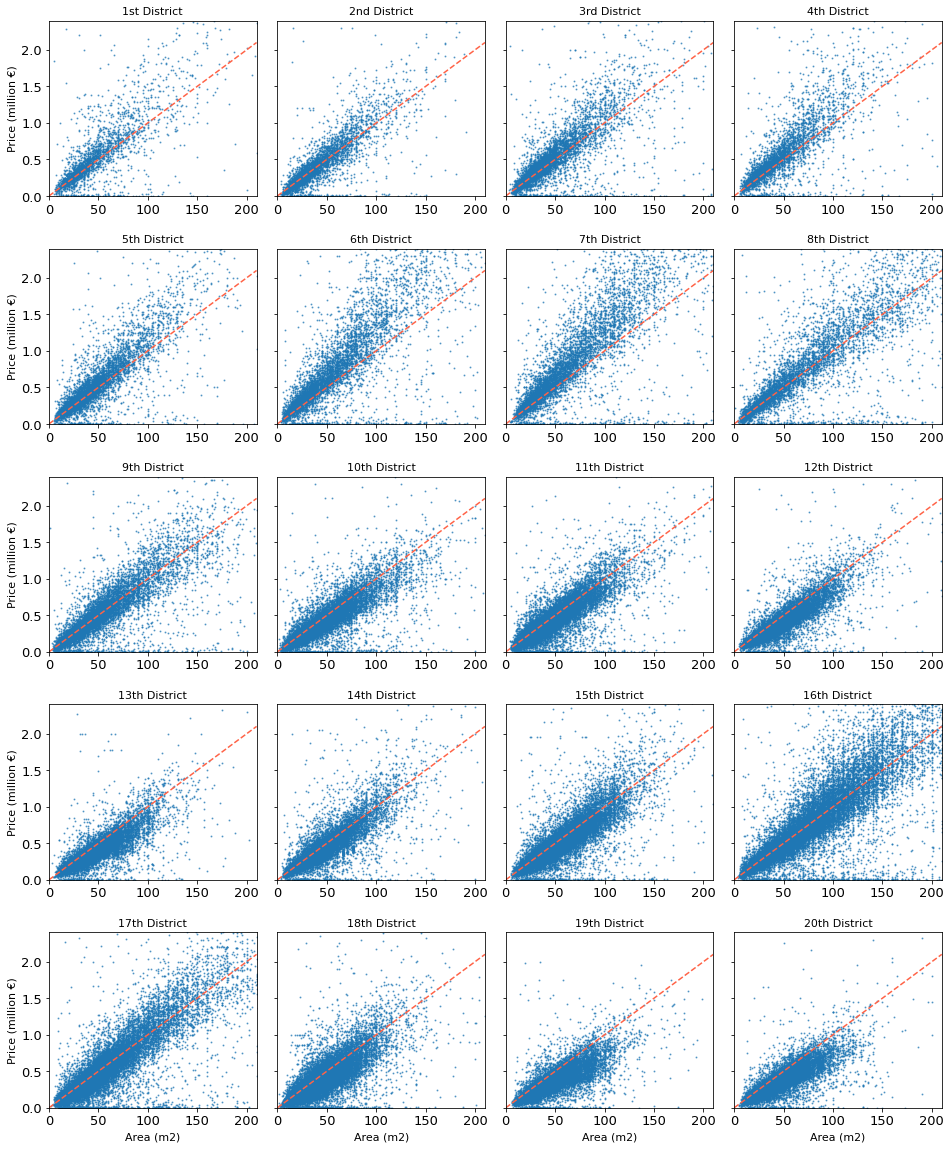
According to this group of scatter plots, we can simply get the relationship
between second-hand apartments’ price and their area. Each point stands for one
transaction, the plots on the red dash line mean that the price per m2 of these
transactions is 10k euros. The points above the dashed line indicate their unit
price is greater than 10k euros; otherwise, it’s less than 10k euros per m2.
For the transactions of the downtown area, most of them are smaller than 50 m2,
but their price varies widely to nearly 2 million euros; on the other hand, for
the 8th, 16th and 17th arrondissement, many sold apartments’ price also arrive
more than 2 million euros, but their area varies widely to 200 m2; moreover,
there are also apartments whose unit price and area don’t vary that widely, as
in 13th, 18th, 19th and 20th arrondissement, most of the apartments here are
smaller than 100 m2 and cheaper than 1 million euros, so than less than 10k
euros per m2.
Price evolution in terms of timing?
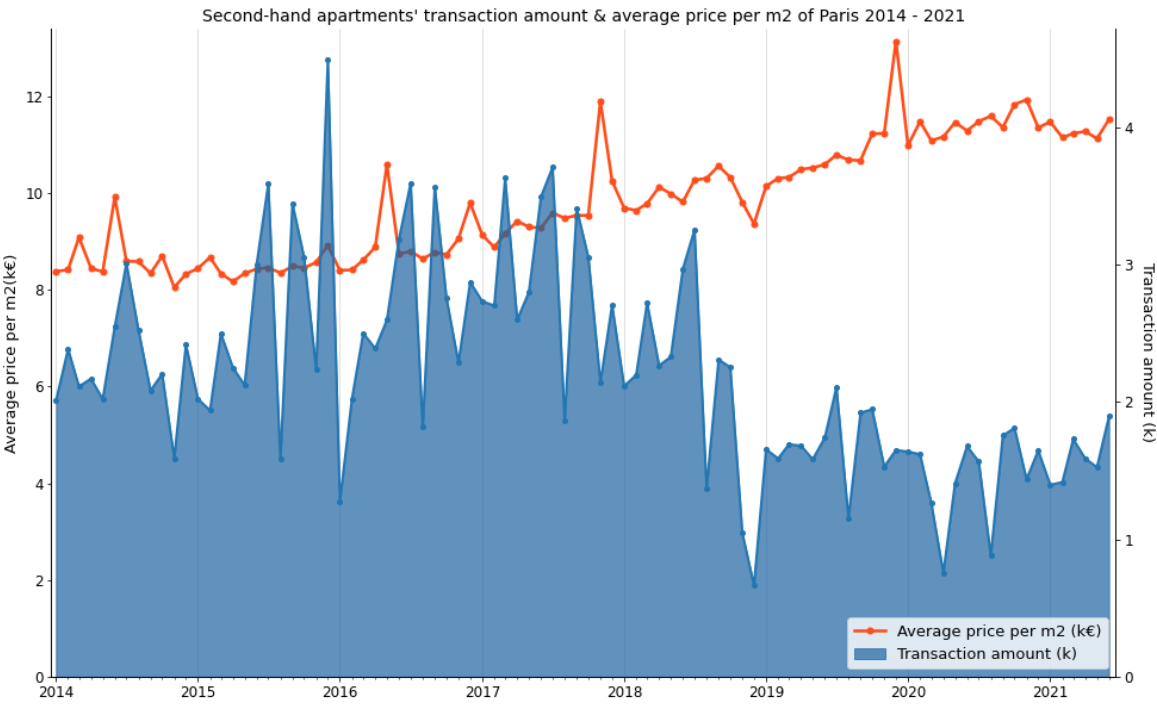
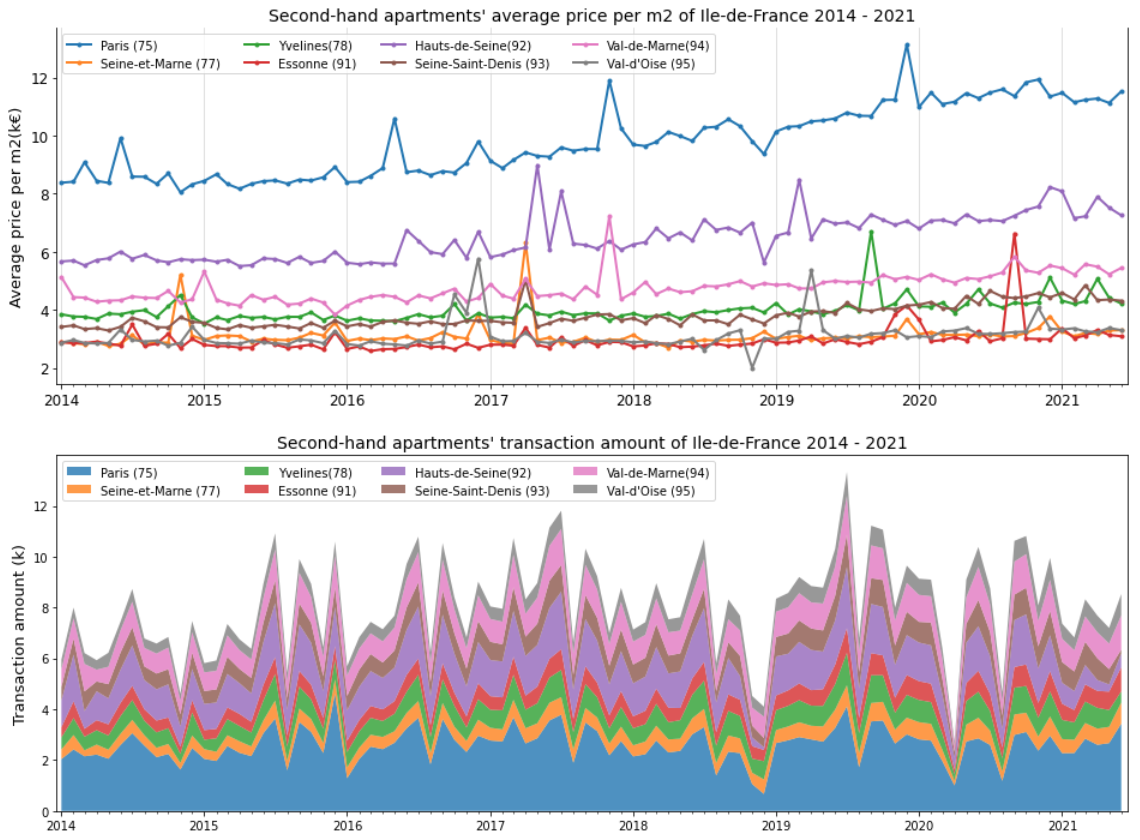
This graph describes second-hand apartments’ transaction amount and average price per m2 of Paris, between January 2014 and June 2021. The orange line shows the monthly average price per m2, the blue area displays the monthly transaction amount. During 7.5 years, the average price per m2 increases 37% (11.5/8.4 - 1), especially from the year 2017, the average price per m2 increases nearly 26% (11.5/9.1 - 1). Moreover, the transaction amount arrives at the yearly lowest point in August, which might be because people go on holiday at that time; on the contrary, the transactions in July or September are higher than other months, which means that people usually sign the purchase promise in May or July (supposed that we have 2 months for negotiating the credit between the purchase promise and purchase agreement), so that they can sign the agreement before their holiday or before the school opening. Moreover, because of the COVID-19 pandemic, the transaction amount dropped 50% in April 2020, then it reverted after the first confinement ended. Impacted by the pandemic, both transaction amount and average price didn’t increase a lot in 2021.
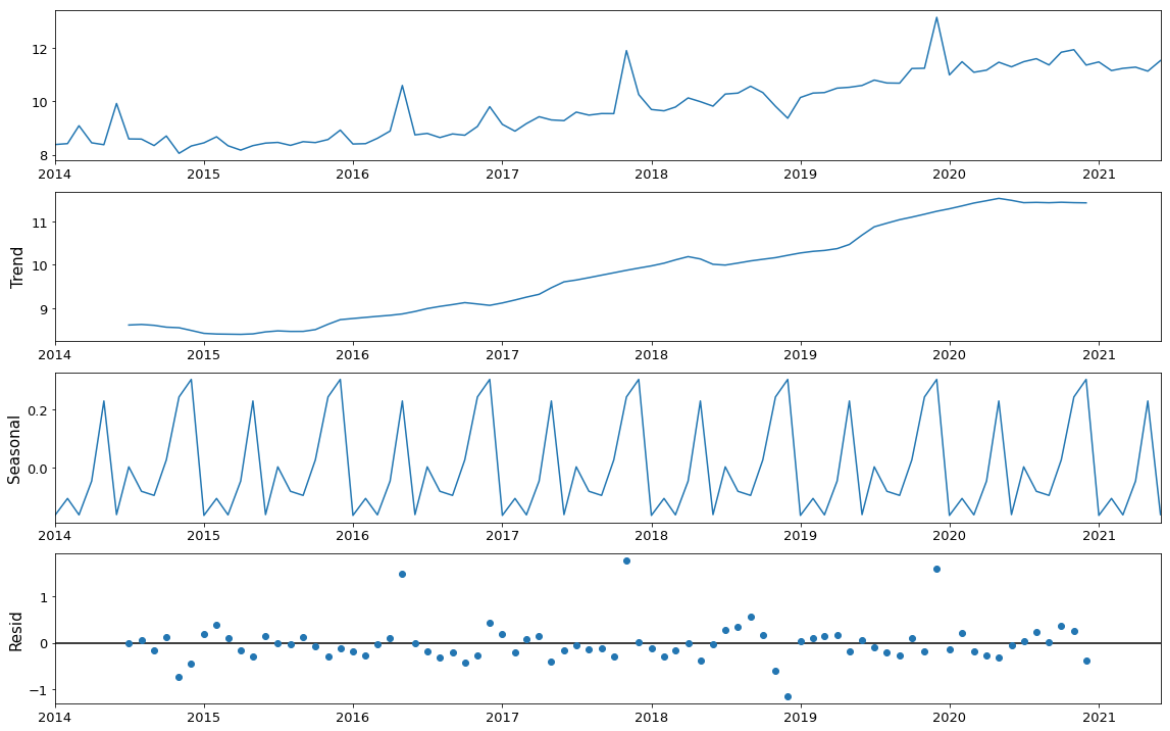
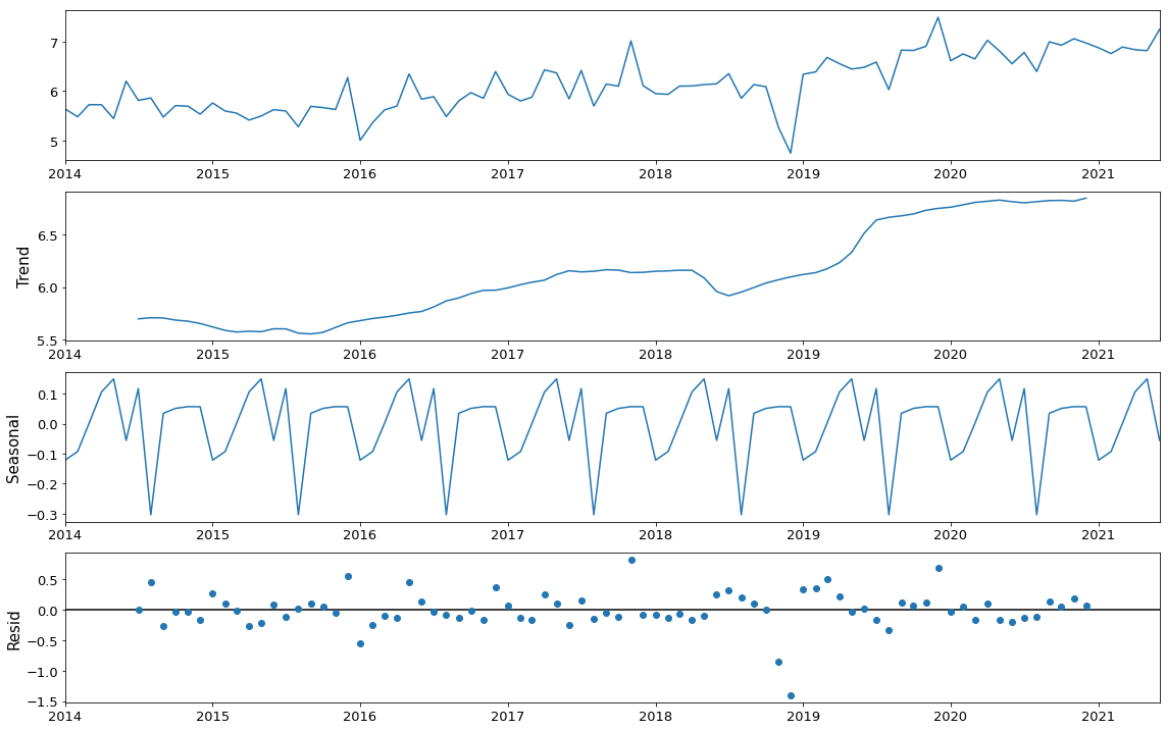
Then I used Time Series additive model to decompose data into a trend
component, a seasonal component, and a residual component. The trend component
captures changes over time, the seasonal component captures cyclical effects due
to the time of year, the residual component captures the influences not
described by the trend and seasonal effects. Thanks to this model, we find that
except for July, there is another transaction peak in January, which we didn’t
find above. In March and June, the transactions arrive at their low points,
that might be because, during the transition period between 2 months, the desire
for purchasing or selling apartments is not that high.
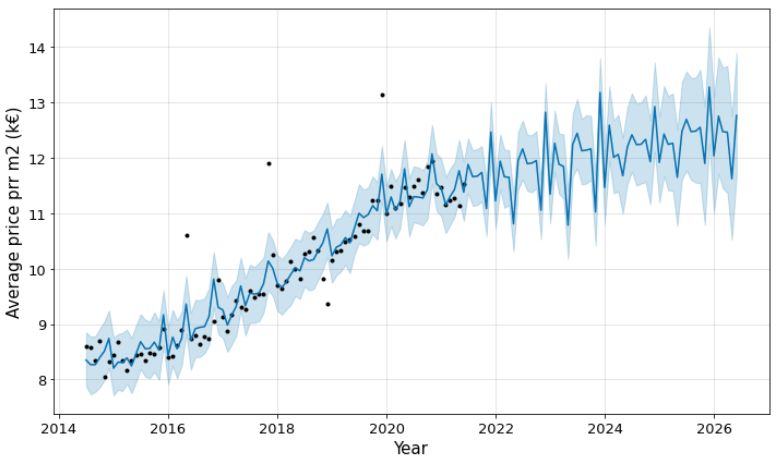
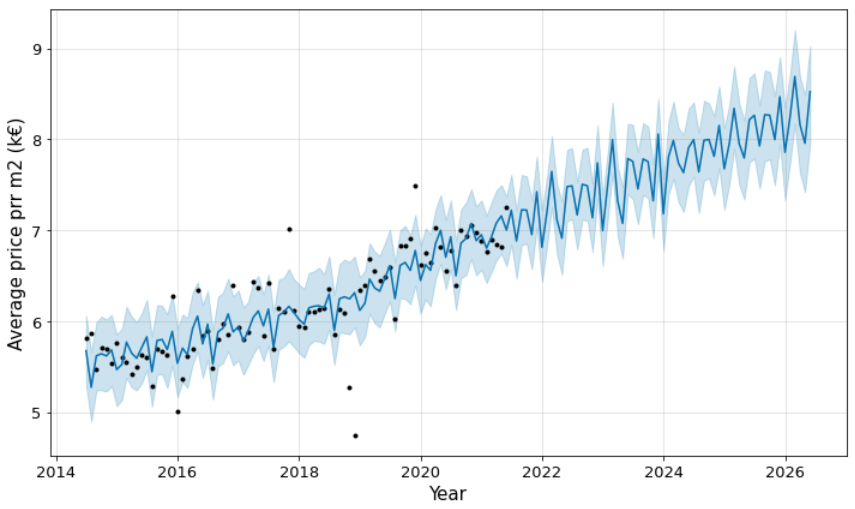
Moreover, I used fbprophet module to predict the price per m2. The black
points present actual values, the blue line indicates the forecasted values,
and the light blue shaded region is the uncertainty. The uncertainty’s region
increases for the prediction because of the initial uncertainty and it grows
over time. This can be impacted by policy, social elements, or some others.
Conclusion
According to this analysis, we find that among all transactions of second-hand
apartments in Paris, T1 and T2 hold 60% transactions. The second-hand apartments
in arrondissements 4, 6, 7 and 8 are much more expensive than other
arrondissements, their average unit price is at least 11800 euros; on the
contrary, the second-hand apartments in arrondissements 18, 19 and 20 are much
cheaper than others, their average unit price is less than 8000 euros.
Reference
- Ministère de l’économie, des finances et de la relance, “Demandes de valeurs foncières”, data.gouv.fr. [Online]. Available: https://www.data.gouv.fr/fr/datasets/5c4ae55a634f4117716d5656/
- Grégoire David, “Departments polygon”, github.com. [Online]. Available: https://github.com/gregoiredavid/france-geojson/blob/master/departements.geojson
- APUR, “APUR : Communes - Ile de France”, data.gouv.fr. [Online]. Available: https://www.data.gouv.fr/fr/datasets/apur-communes-ile-de-france/
- “Paris”, en.wikipedia.org. [Online]. Available: https://en.wikipedia.org/wiki/Paris
- Ehi Aigiomawu, “Analyzing time series data in Pandas”, towardsdatascience.com. [Online]. Available: https://towardsdatascience.com/analyzing-time-series-data-in-pandas-be3887fdd621
- Will Koehrsen, “Time Series Analysis in Python: An Introduction”, towardsdatascience.com. [Online]. Available: https://towardsdatascience.com/time-series-analysis-in-python-an-introduction-70d5a5b1d52a
- “Rent apartment Paris 18”, parisattitude.com. [Online]. Available: https://www.parisattitude.com/rent-apartment-paris-18.aspx
- “Guide immobilier Paris 16ème arrondissement”, engelvoelkers.com. [Online]. Available: https://www.engelvoelkers.com/fr-fr/paris/guide-immobilier-16eme-arrondissement/
- Walkerssk, “Paris France Eiffel tower night”, pixabay.com. [Online]. Available: https://pixabay.com/photos/paris-france-eiffel-tower-night-1836415/
]]>


