During the work we need to automate some reports frequently, including
manipulating excel workbook. In this blog I will introduce some basic
manipulations on excel workbook by openpyxl package.
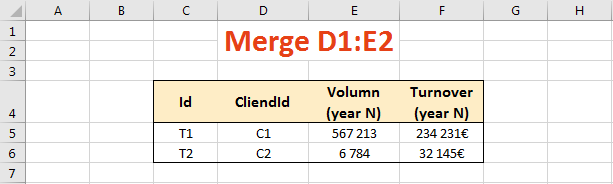
In the following, I will create a workbook, write values into one worksheet, and some handling like merging cells, set font size/color/type, set background color, set borders, etc.
Before coding, I’ll import all packages we need.
import openpyxl
from openpyxl.styles import Alignment
from openpyxl.styles import Font
from openpyxl.styles import PatternFill
from openpyxl.styles.borders import Border, Side
from openpyxl.workbook import Workbook
import string
Now, let’s start!
# Create a workbook
wb = Workbook()
dest_filename = 'test.xlsx'

ws_test = wb.active
ws_test.title = 'test_wksht'
Workbook() helps us to create a workbook, use active module to assign actual
worksheet and use title module to name it.
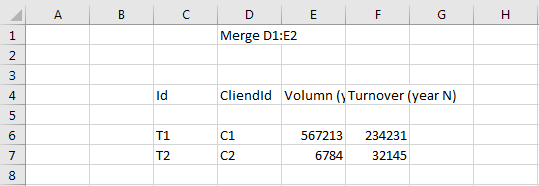
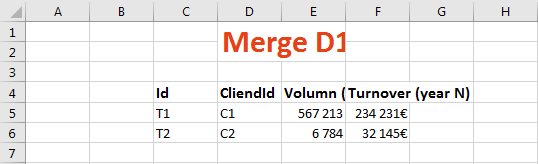
Write values
VAL_POS_MAP = {'Merge D1:E2': 'D1',
               'Id': 'C4',
               'T1': 'C6',
               'T2': 'C7',
               'CliendId': 'D4',
               'C1': 'D6',
               'C2': 'D7',
               'Volumn (year N)': 'E4',
               567213: 'E6',
               6784: 'E7',
               'Turnover (year N)': 'F4',
               234231: 'F6',
               32145: 'F7'}

for value, pos in VAL_POS_MAP.items():
    ws_test[pos] = value
We can write values into specified cells with pattern worksheet[cells] = value.
Here I iterate a map, who contains values and cells’ positions, to write values
iteratively.
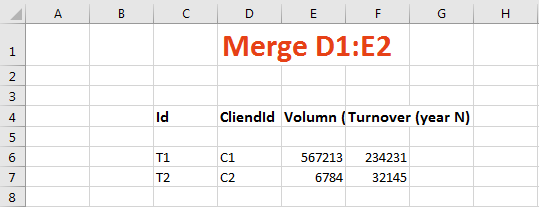
Font (size, type, bold, italic)
GLOBAL_TITLE_FONT = Font(name='Calibri',
                         size=24,
                         bold=True,
                         italic=False,
                         vertAlign=None,
                         underline='none',
                         strike=False,
                         color='e64117')

SUBTITLE_FONT = Font(name='Calibri',
                     size=12,
                     bold=True,
                     italic=False,
                     vertAlign=None,
                     underline='none',
                     strike=False,
                     color='000000')

SZ14_FONT = Font(name='Calibri',
                 size=11,
                 bold=False,
                 italic=False,
                 vertAlign=None,
                 underline='none',
                 strike=False,
                 color='000000')

BG_YELLOW_LIST = ['C4', 'D4', 'E4', 'F4']
CONTENT_LIST = ['C6', 'C7', 'D6', 'D7', 'E6', 'E7', 'F6', 'F7']

ws_test['D1'].font = GLOBAL_TITLE_FONT

for pos in BG_YELLOW_LIST:
    ws_test[pos].font = SUBTITLE_FONT

for pos in CONTENT_LIST:
    ws_test[pos].font = SZ14_FONT
According to openpyxl, we can set font styles(size/color/type) by different
arguments of Font(). Then assign worksheet[cells].font equals to Font()
setting.
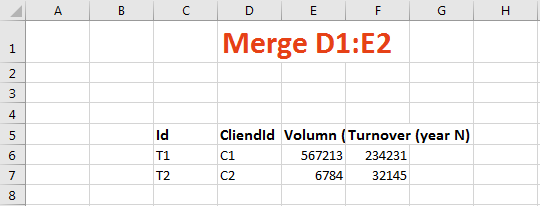
Cut and paste values from C4:F4 to C5:F5
for col in string.ascii_uppercase[2:6]:
    new_pos = col + '5'
    old_pos = col + '4'

    ws_test[new_pos].value = ws_test[old_pos].value
    if ws_test[old_pos].has_style:
        ws_test[new_pos]._style = ws_test[old_pos]._style
    ws_test[old_pos].value = None
Here I use string.ascii_uppercase to generate automatically from letter C to
letter F, and copy values from row 4 to row 5. But if we only copy value, font
style will be lost, so I also copied cell’s style with ._style for the one
who .has_style==True.
Remove row 4
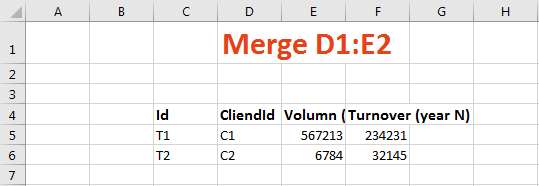
ws_test.delete_rows(idx=4)Since we don’t need the fourth row any more, I removed it by delete_rows().
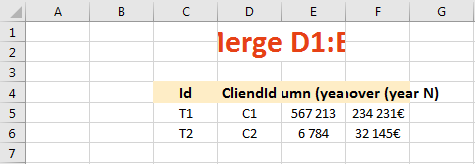
Merge C1:D2 and set number format
ws_test.merge_cells('D1:E2')

EURO_LIST = ['F5', 'F6']
SEP_K_LIST = ['E5', 'E6']
for pos in EURO_LIST:
    ws_test[pos].number_format = '#,##0€'
for pos in SEP_K_LIST:
    ws_test[pos].number_format = '#,##0'
Then I merge cells from D1 to E2 with worksheet.merge_cells. If you want to
set numbers’ format, like currency or display a thousands separator, you can
specify module number_format’s value.
Set cells’ background colors and center characters
# background colors
for pos in BG_YELLOW_LIST:
    ws_test[pos].fill = PatternFill(start_color="feedc6",
                                    end_color="feedc6",
                                    fill_type="solid")

# center characters
for row_cells in ws_test.iter_rows():
    for cell in row_cells:
        cell.alignment = Alignment(horizontal='center',
                                   vertical='center')
When we want to highlight header, adding the background color might be a good
idea. Then we can assign worksheet[cell].fill to PatternFill(), with RBG
colors. Moreover, I wanted to center horizontal and vertical alignment for all
cells. So I iterated all cells, and set their alignment module as center.
Wrap text in cells
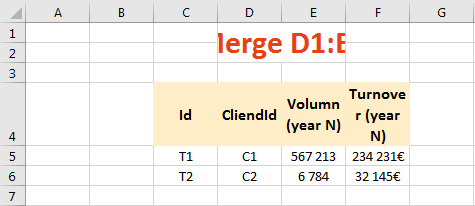
SUBTITLE_ALIGN = Alignment(wrap_text=True, horizontal='center', vertical='center')
for row in ['4:4']:
    for cell in ws_test[row]:
        cell.alignment = SUBTITLE_ALIGN
Since characters in each cell of row 4 are a little bit more, we can wrap them
with wrap_text=True of Alignment() for each cell in row 4.
Reset columns’ width
for col in ['D', 'E']:
    ws_test.column_dimensions[col].width = 13
ws_test.column_dimensions['F'].width = 12
Sometimes, a cell contains lots of characters and cannot be displayed by default.
In this case, if you want to display all, you can set cell’s width, with pattern
worksheet.column_dimensions[column].width.
Set borders
BORDER_LIST = ['C4:F4', 'C5:F6']

def set_border(ws, cell_range):
    rows = ws[cell_range]
    side = Side(border_style='thin', color="FF000000")

    rows = list(rows)
    max_y = len(rows) - 1  # index of the last row
    for pos_y, cells in enumerate(rows):
        max_x = len(cells) - 1  # index of the last cell
        for pos_x, cell in enumerate(cells):
            border = Border(
                left=cell.border.left,
                right=cell.border.right,
                top=cell.border.top,
                bottom=cell.border.bottom
            )
            if pos_x == 0:
                border.left = side
            if pos_x == max_x:
                border.right = side
            if pos_y == 0:
                border.top = side
            if pos_y == max_y:
                border.bottom = side

            # set new border only if it's one of the edge cells
            if pos_x == 0 or pos_x == max_x or pos_y == 0 or pos_y == max_y:
                cell.border = border

# border
for pos in BORDER_LIST:
    set_border(ws_test, pos)
Next, I used a function set_border() that found on stackoverflow.
In this function, it used Side() and Border() to set outside borders for
given cells.
Hide grid and set zoom scale
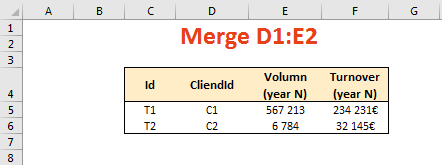
ws_test.sheet_view.showGridLines = False
ws_test.sheet_view.zoomScale = 80
Furthermore, if you want to hide all grid lines or set zoom scale, you can use
worksheet.sheet_view.showGridLines or worksheet.sheet_view.zoomScale.
Create named range
wb.create_named_range('ZoneId', ws_test, '$C$4:$C$6')workbook.create_named_range() create named ranges from C4 to C6, in ws_test
worksheet, named ‘ZoneId’.
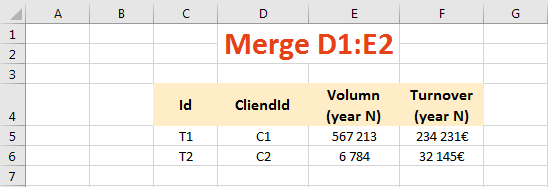
Save
wb.save(dest_filename)Finally, save the workbook to given path with workbook.save().
Voila, result as follows:

Reference
- “0*eSQte3e-rJeH7bu8”, miro.medium.com. [Online]. Available: https://miro.medium.com/max/1400/0*eSQte3e-rJeH7bu8.jpg