This blog is part of Matplotlib Series:
- Matplotlib Series 1: Bar chart
- Matplotlib Series 2: Line chart
- Matplotlib Series 3: Pie chart (this blog)
- Matplotlib Series 4: Scatter plot
- Matplotlib Series 5: Treemap
- Matplotlib Series 6: Venn diagram
- Matplotlib Series 7: Area chart
- Matplotlib Series 8: Radar chart
- Matplotlib Series 9: Word cloud
- Matplotlib Series 10: Lollipop plot
- Matplotlib Series 11: Histogram
Pie chart
A pie chart (or a circle chart) is a circular statistical graphic which is divided into slices to illustrate numerical proportion. In a pie chart, the arc length of each slice (and consequently its central angle and area), is proportional to the quantity it represents.
When to use it ?
- Show percentage or proportional data.
- Less than 7 categories.
- Display data that is classified into nominal or ordinal categories.
- Try to use positive values.
Example
import matplotlib.pyplot as plt
labels = 'apple', 'banana', 'cherry', 'durian', 'elderberries', 'figs', 'grapes'
sizes = [32, 20, 15, 10, 10, 8, 5]
p = plt.pie(sizes, labels=labels, explode=(0.07, 0, 0, 0, 0, 0, 0),
autopct='%1.1f%%', startangle=130, shadow=True)
plt.axis('equal')
for i, (apple, banana, cherry, durian, elderberries, figs, grapes) in enumerate(p):
if i > 0:
apple.set_fontsize(12)
banana.set_fontsize(12)
cherry.set_fontsize(12)
durian.set_fontsize(12)
elderberries.set_fontsize(12)
figs.set_fontsize(12)
grapes.set_fontsize(12)
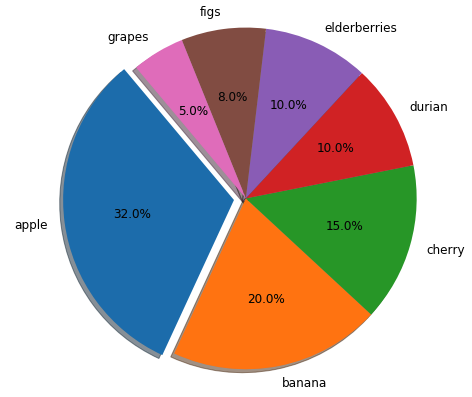
plt.show()This pie chart describes the turnovers’ percentage for each fruit. Sales of apple bring the most turnover among 7 fruits, who presents 32% of turnover. If the values represent volume instead of turnover, then we should prepare more apples than other fruits in the store.
Donut chart
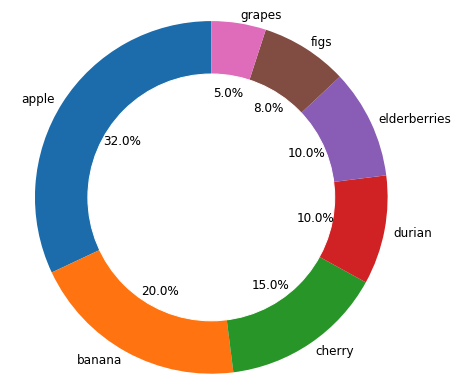
A donut chart is a variant of the pie chart, with a blank center allowing for additional information about the data as a whole to be included. This type of circular graph can support multiple statistics at once and it provides a better data intensity ratio to standard pie charts. It does not have to contain information in the center.
Example
my_circle = plt.Circle((0, 0), 0.7, color='white')

d = plt.pie(sizes, labels=labels, autopct='%1.1f%%',
            startangle=90, labeldistance=1.05)
plt.axis('equal')
plt.gca().add_artist(my_circle)

plt.show()
Extracly the same implication as the pie chart above.
Nested pie chart
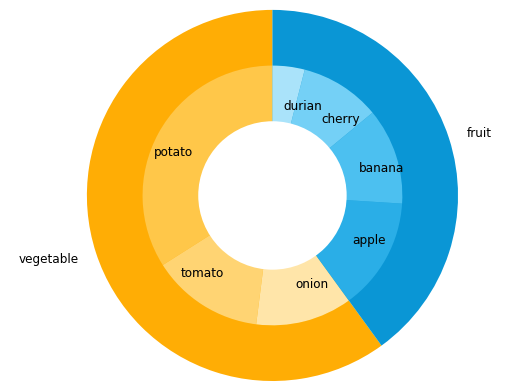
A nested pie chart or multi-level pie chart allows you to incorporate multiple levels or layers into your pie. Nested pies are a module variation on our standard pie chart type.
When to use it ?
- Show symmetrical and asymmetrical tree structures in a consolidated pie-like structure.
- Multi-tiered data presentation, e.g., keyword analysis
- Inter-linked tree data, e.g., friends of friends
Example
labels = ['vegetable', 'fruit']
sizes = [300, 200]
labels_vegefruit = ['potato', 'tomato', 'onion', 'apple',
                    'banana', 'cherry', 'durian']
sizes_vegefruit = [170, 70, 60, 70, 60, 50, 20]
colors = ['#FFB600', '#09A0DA']
colors_vegefruit = ['#FFCE53', '#FFDA7E', '#FFE9B2', '#30B7EA',
                    '#56C7F2','#7FD6F7', '#B3E7FB']

bigger = plt.pie(sizes, labels=labels, colors=colors,
                 startangle=90, frame=True)
smaller = plt.pie(sizes_vegefruit, labels=labels_vegefruit,
                  colors=colors_vegefruit, radius=0.7,
                  startangle=90, labeldistance=0.7)
centre_circle = plt.Circle((0, 0), 0.4, color='white', linewidth=0)
fig = plt.gcf()
fig.gca().add_artist(centre_circle)

plt.axis('equal')
plt.tight_layout()

plt.show()
This chart specifies a second level for consommation of vegetable and fruit, respectively. In general, vegetable is more consummed than fruit. Among three vegetables, potato is much more popular than others; among 4 fruits, apple is the most sold. Thus, for the retailers, they need to prepare more potatoes and apples than other vegetables and fruits.
You can click here to check this example in jupyter notebook.
Reference
- Steve Johnson, “painting wallpaper”, www.pexels.com. [Online]. Available: https://www.pexels.com/photo/painting-wallpaper-1070527/