This blog is part of Matplotlib Series:
- Matplotlib Series 1: Bar chart
- Matplotlib Series 2: Line chart
- Matplotlib Series 3: Pie chart
- Matplotlib Series 4: Scatter plot
- Matplotlib Series 5: Treemap (this blog)
- Matplotlib Series 6: Venn diagram
- Matplotlib Series 7: Area chart
- Matplotlib Series 8: Radar chart
- Matplotlib Series 9: Word cloud
- Matplotlib Series 10: Lollipop plot
- Matplotlib Series 11: Histogram
Treemap
Treemaps display hierarchical (tree-structured) data as a set of nested rectangles. Each branch of the tree is given a rectangle, which is then tiled with smaller rectangles representing sub-branches. A leaf node’s rectangle has an area proportional to a specified dimension of the data. Often the leaf nodes are colored to show a separate dimension of the data.
When to use it ?
- Less than 10 branches
- Positive values
- Space for visualisation is limited.
Example
import numpy as np
import matplotlib.pyplot as plt
import squarify
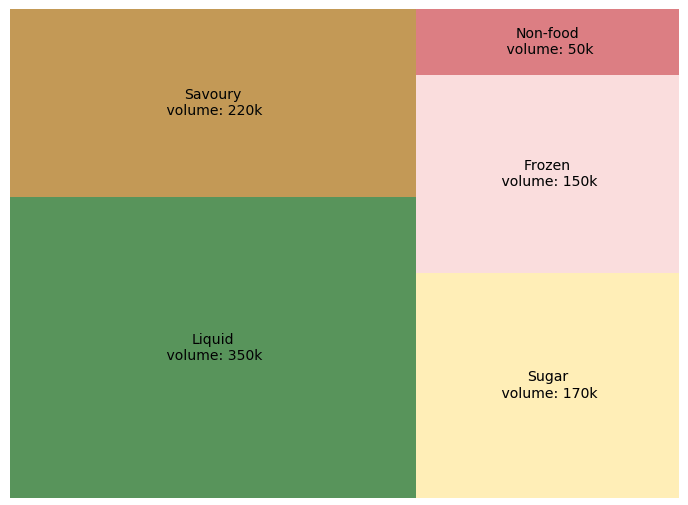
volume = [350, 220, 170, 150, 50]
labels = ['Liquid\n volume: 350k', 'Savoury\n volume: 220k',
'Sugar\n volume: 170k', 'Frozen\n volume: 150k',
'Non-food\n volume: 50k']
color_list = ['#0f7216', '#b2790c', '#ffe9a3',
'#f9d4d4', '#d35158', '#ea3033']
plt.rc('font', size=14)
squarify.plot(sizes=volume, label=labels,
color=color_list, alpha=0.7)
plt.axis('off')
plt.show()This treemap describes volume for each product universe with corresponding surface. Liquid products are more sold than others. If you want to explore more, we can go into products “liquid” and find which shelves are prefered by clients.
Counter-example
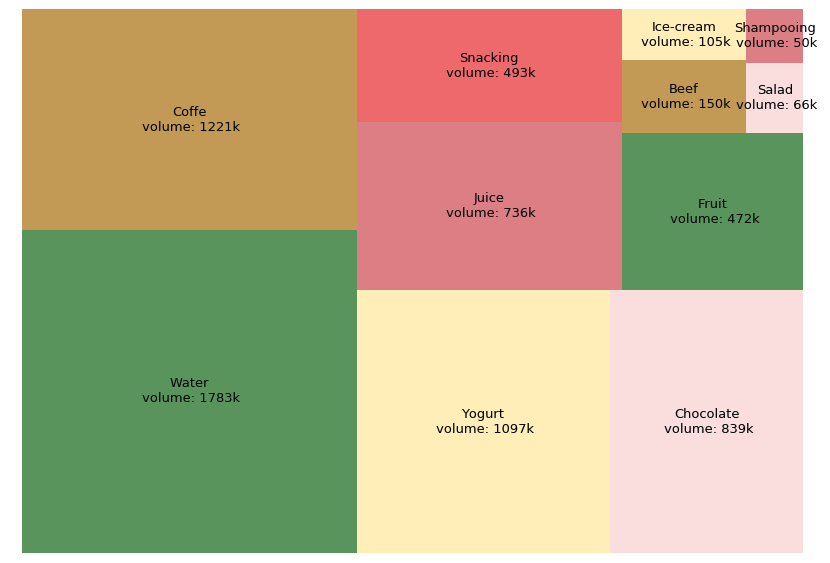
volume = [1783, 1221, 1097, 839, 736, 493,
          472, 150, 105, 66, 50]
labels = ['Water\n volume: 1783k',
          'Coffe\n volume: 1221k',
          'Yogurt\n volume: 1097k',
          'Chocolate\n volume: 839k',
          'Juice\n volume: 736k',
          'Snacking\n volume: 493k',
          'Fruit\n volume: 472k',
          'Beef\n volume: 150k',
          'Ice-cream\n volume: 105k',
          'Salad\n volume: 66k',
          'Shampooing\n volume: 50k']

squarify.plot(sizes=volume, label=labels,
              color=color_list, alpha=0.7)

plt.show()
This example shows the reason why a treemap should have less than 10 branches. In the plot above, there are 11 branches, and at the top right corner, the surface for branches “Salad” and “Shampooing” is too small to display the information clearly. Thus, a treemap whth less than 10 branches is a better choice.
You can click here to check this example in jupyter notebook.
Reference
- Steve Johnson, “painting wallpaper”, www.pexels.com. [Online]. Available: https://www.pexels.com/photo/painting-wallpaper-1070527/