This blog is part of Matplotlib Series:
- Matplotlib Series 1: Bar chart
- Matplotlib Series 2: Line chart
- Matplotlib Series 3: Pie chart
- Matplotlib Series 4: Scatter plot
- Matplotlib Series 5: Treemap
- Matplotlib Series 6: Venn diagram
- Matplotlib Series 7: Area chart
- Matplotlib Series 8: Radar chart
- Matplotlib Series 9: Word cloud (this blog)
- Matplotlib Series 10: Lollipop plot
- Matplotlib Series 11: Histogram
Word cloud
A word cloud (tag cloud, or weighted list in visual design) is a novelty visual representation of text data. Tags are usually single words, and the importance of each tag is shown with font size or color. This format is useful for quickly perceiving the most prominent terms and for locating a term alphabetically to determine its relative prominence.
When to use it ?
- Depicting keyword metadata (tags) on websites.
- Delighting and provide emotional connection.
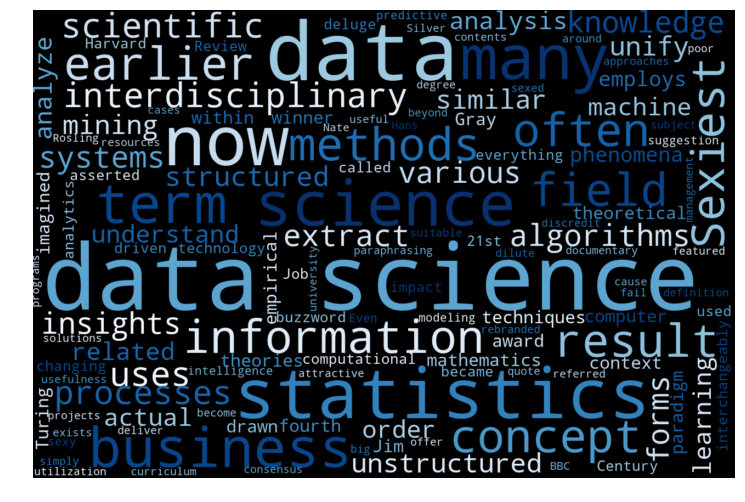
Example 1: Basic word cloud
from wordcloud import WordCloud
import matplotlib.pyplot as plt
from PIL import Image
import numpy as np

text = ('Data science is an interdisciplinary field that uses scientific
methods, processes, algorithms and systems to extract knowledge and insights
from data in various forms, both structured and unstructured, similar to data
mining. Data science is a concept to unify statistics, data analysis, machine
learning and their related methods in order to understand and analyze actual
phenomena with data. It employs techniques and theories drawn from many fields
within the context of mathematics, statistics, information science, and
computer science. Turing award winner Jim Gray imagined data science as a
fourth paradigm of science (empirical, theoretical, computational and now
data-driven) and asserted that everything about science is changing because of
the impact of information technology and the data deluge. In 2012, when Harvard
Business Review called it The Sexiest Job of the 21st Century, the term data
science became a buzzword. It is now often used interchangeably with earlier
concepts like business analytics, business intelligence, predictive modeling,
and statistics. Even the suggestion that data science is sexy was paraphrasing
Hans Rosling, featured in a 2011 BBC documentary with the quote, Statistics is
now the sexiest subject around. Nate Silver referred to data science as a sexed
up term for statistics. In many cases, earlier approaches and solutions are now
simply rebranded as data science to be more attractive, which can cause the
term to become dilute beyond usefulness. While many university programs now
offer a data science degree, there exists no consensus on a definition or
suitable curriculum contents. To its discredit, however, many data-science and
big-data projects fail to deliver useful results, often as a result of poor
management and utilization of resources')

wordcloud = WordCloud(width=1280, height=853, margin=0,
                      colormap='Blues').generate(text)

plt.imshow(wordcloud, interpolation='bilinear')
plt.axis('off')
plt.margins(x=0, y=0)
plt.show()
According to this word cloud, we can globally know that data science employs techniques and theories drawn from many fields within the context of mathematics, statistics, information science, and computer science. It can be used for business analysis, and called “The Sexiest Job of the 21st Century”.
Example 2: Word cloud with specific shape
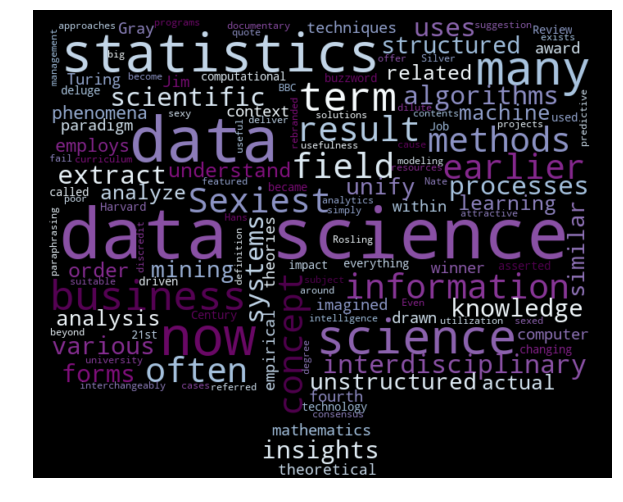
computer_mask = np.array(Image.open('computer_shape.png'))
wordcloud_shape = WordCloud(width=1280, height=853, margin=0,
                            colormap='BuPu',
                            mask=computer_mask).generate(text)

plt.imshow(wordcloud_shape, interpolation="bilinear")
plt.axis('off')
plt.margins(x=0, y=0)
plt.show()
You can click here to check this example in jupyter notebook.
Reference
- Data Science(Wikipedia)
- Image computer apple mac
- Steve Johnson, “painting wallpaper”, www.pexels.com. [Online]. Available: https://www.pexels.com/photo/painting-wallpaper-1070527/