Year 2020 comes soon, now it’s time to review the whole year 2019. This year I improved my SQL, python and analysis skills, learnt and applied some Machine Learning algorithms. In the following, I’ll talk about:
- Working in retailing
- Self-learning
- Open source projects contributions
- Climate Change Series
- Airbnb Paris Analysis
- Second-hand apartments transactions in Paris
- Blogs
Working in retailing
bibi! for loyalty program
“bibi!” it is the new franprix customer benefits’ program, it’s unique, generous and personalized. In order to understand if this new program works well, I create a dashboard for CRM team with data as the transaction’s and turnover’s quote-part with “bibi!”, so that they can make decisions with data support.
Cooperate with HEMA
HEMA, a department store of sorts, which sells only own-brand products, is ubiquitous on the Dutch high street, but that doesn’t mean it’s pedestrian in any way. Instead, the wide range of household products and homewares HEMA sells is incredibly well-designed in a distinctive simple, fresh and modern style. Cosmetics, clothes, food and other product ranges are available too.
In 2019, franprix is betting on non-food and is establishing a partnership with the HEMA brand, specializing in design bazaar products. From the 10th September, in 15 Parisian franprix stores, HEMA makes your life easier and more fun.
In order to follow the performance of Hema’s products in franprix stores, I created a weekly report as above, so that innovation team could have an idea of how many Hema’s products are sold in each franprix store, and how many turnover is created by them.
Improvement in stores’ coordinates
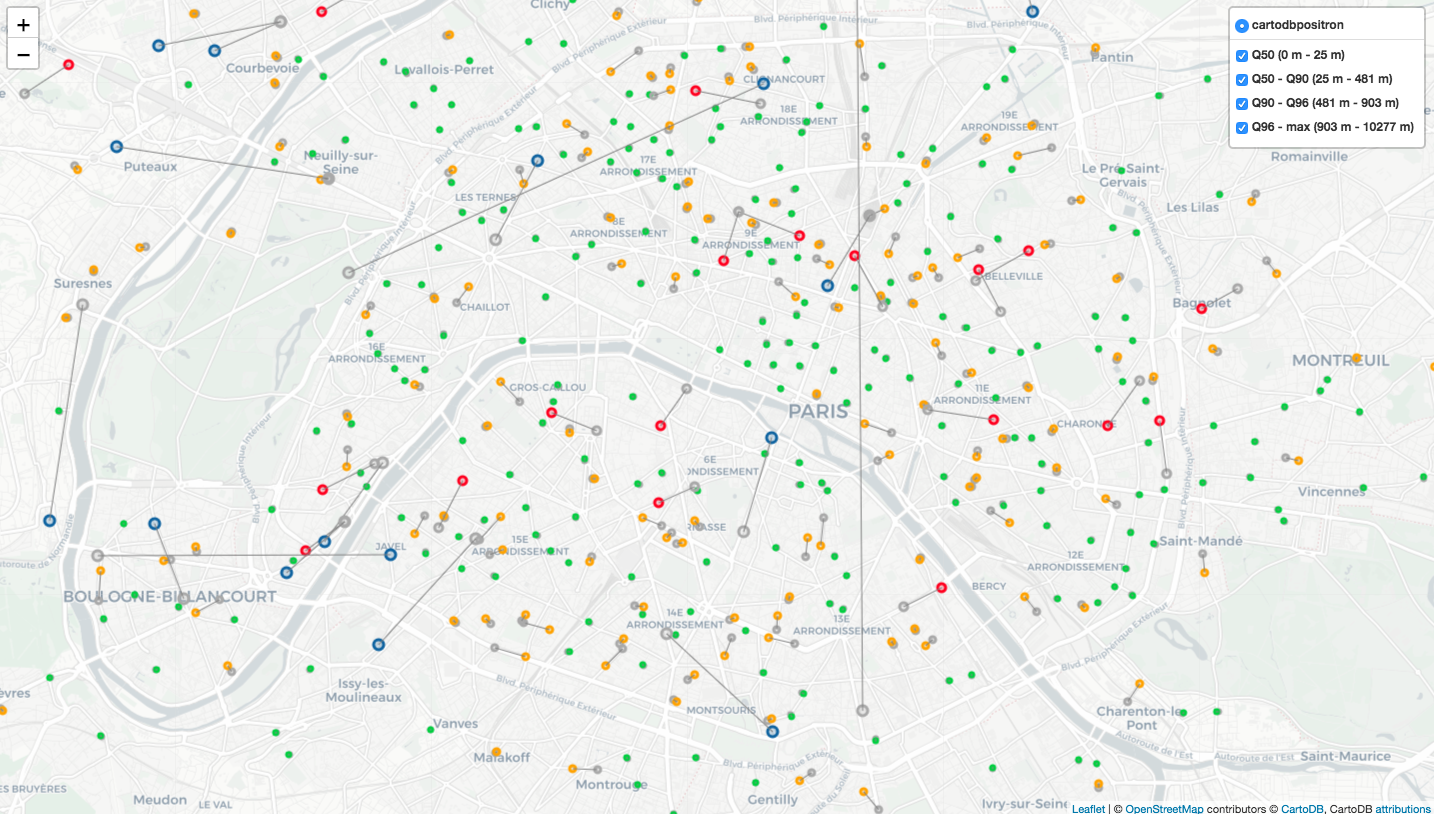
We have latitude and longitude for each store in our internal system, but some are not that exact, so we decide to check and update geolocation’s information for each store, and specify the haversine distance between geolocation of internal system and new defined geolocation. In the map above, each gray point presents the coordinates in our internal system, the colored point that connected to the gray point by a line is the updated coordinates. So that we can see how large the gap between two coordinates.
What did I learn during working?
During the working, I enriched my knowledge of data precessing performance, geovisualisation and other subjects.
For creating reports, I learnt how to create a python package which helps us to install only the necessary modules and pack elements for each report together. The structure of the package is similar to the following:
$ tree
.
├── __init__.py
├── data
│   ├── __init__.py
│   └── job.sql
├── setup.py
├── job.py
│── tests
│   ├── __init__.py
│   └── job_test.py
├── .gitlab-ci.yml
└── environment.yml
Moreover, when creating multiple reports by python scripts, we usually face the situation that different versions of one python module is needed for different reports. In this case, maybe creating a virtual environment for this project is a good choice. The virtual environment allows you to use a certain version of a module for one project and another version for another project: if you install the module system-wide and don’t use venv, then you can only use one version of the module.
Since we created numerous reports and the logic for some of them are pretty
complex, we need to pay attention to the processing performance.
For example, we can take advantage of SQL query when we extract data, like
replace python function by COALESCE in Teradata SQL or replace
pandas.merge() by JOIN in SQL; we can also apply map or lambda rather
than for loop.
After data processing, we visualised data in order to facilitate the
understanding. Considering we have lots of stores in different cities in
France, I learnt how to draw a variety of maps with folium
module.
Furthermore, we need to save our reports in our Linux server. Thanks to this step, I know how to transfer files with Putty between Windows OS and Linux OS.
Self-learning
In this year, I enriched my knowledge of Machine Learning models and algorithms by reading the book “Hands-On Machine Learning with Scikit-Learn & TensorFlow”, understood various classification & regression models, and applied them with Kaggle projects.
For instance, I applied Support Vector Machine, Decision Trees, Random Forest, AdaBoost, Extra Trees, Gradient Boosting and Voting Classifier to predict which passengers survived the tragedy of the Titanic event. I also applied Linear Regression, Ridge Regression, Lasso Regression, Elastic Net, Gradient Boosting Regressor and XGBoost Regressor to predict the sales price for each house.
On the 23rd May 2019, I participated in the Data Science Olympics which was held simultaneously in Berlin and Paris, and its duration is 2 hours. The context of challenge is the DGCS (french acronym for Direction Générale de la Cohésion des Territoires, in English General Directorate for Territorial Cohesion) is linked to the French ministry of territorial cohesion. Its mission is to design, direct and evaluate public policies regarding solidarity, social development and equality promotion so as to foster social cohesion and support people self-reliance. Recently, the DGCS renovated and standardized the information system of the centers responsible for emergency housing distribution. The data of this challenge comes from this renovation project. The goal is to predict the number of nights an emergency service can provide to an individual or a group (couple, family, …). During this competition, I applied several models like Decision Trees, Random Forest, Adaboost, Extra Trees, Gradient Boosting and Voting classifier to do the prediction. My final note is top 20 (rank: 49/240).
Besides learning and apply Machine Learning algorithms, I also did some analysis on interesting subjects. In the following, I’ll present them to you.
Open source projects contributions
This year I have my first contributions to two open source projects: scutan90’s DeepLearning-500-questions and MrMimic’s data-scientist-roadmap.
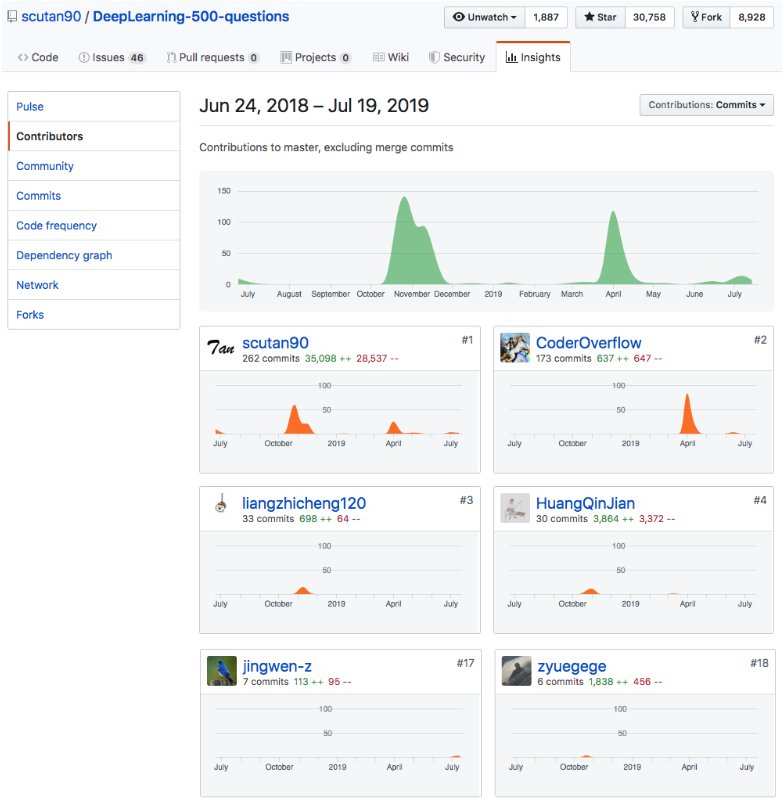
The project “DeepLearning-500-questions” contains 500 questions for Deep Learning, it explained probabilistic knowledge, linear algebra, machine learning, deep learning, computer vision and other hot topics. In this project, I contributed to the Machine Learning’s part, which are related to Gradient Descent, Support Vector Machine and Bayesian classifier.
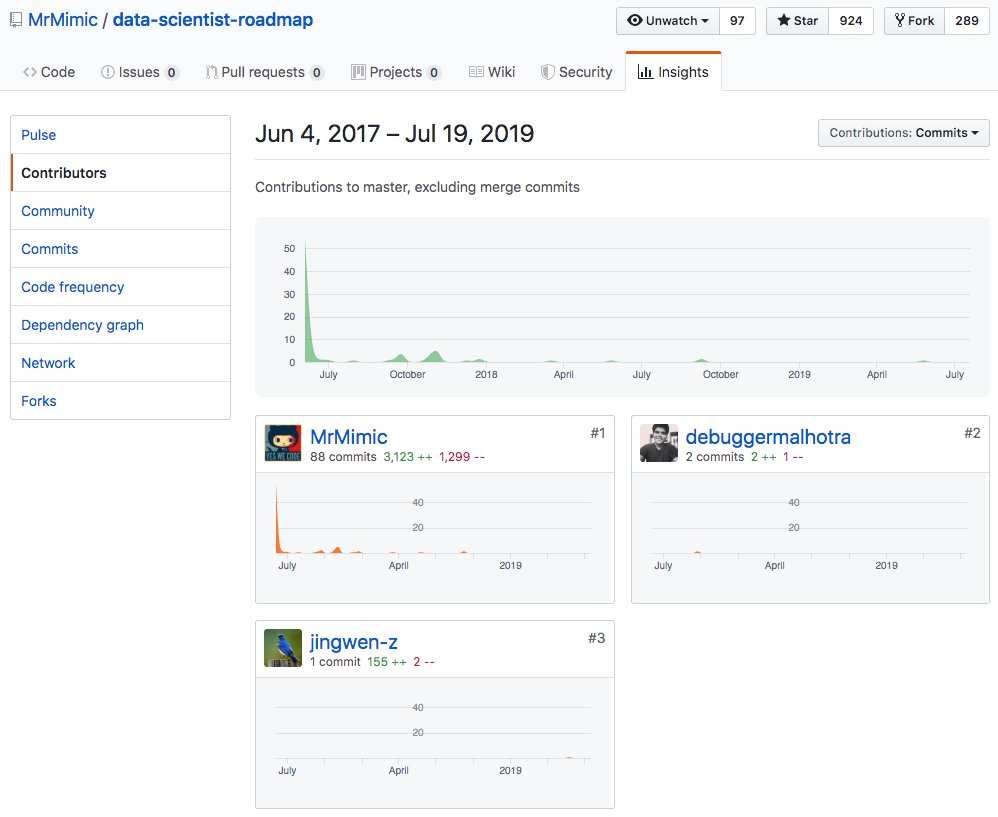
The project “data-scientist-roadmap” presents a bunch of tutorials which complete this roadmap, helping whoever wants to start learning stuff about data science. In this project, I contributed to the part of Data Visualisation, specified the usages of different types of graphs like tree map, scatter plot, line chart, venn diagram, area chart, radar chart and word cloud.
Climate Change Series
I found some open-source data related to climate change which are meaningful to study, I took some of them and analysed in 4 subjects: Population, CO2 emission, Electric and energy use and Forest area. Since the results are rich, you can click the lien if they interest you.
Airbnb Paris Analysis
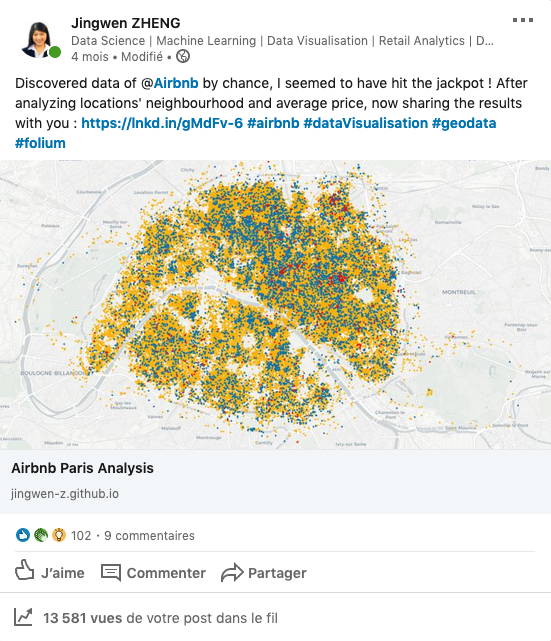
Paris is the capital and most populous city of France, and it also attracts
lots of tourists, which makes me eager to dig out Airbnb locations in Paris. I
analysed distribution and evolution of locations and price for Airbnb Paris between 05/2015 and 07/2019, applied Python folium module
to geovisualise the result with OpenStreetMap.
According to this analysis, we find that the majority of Airbnb locations in Paris are entire home/apartment; most of the locations are location at Buttes-Montmartre, Popincourt and Vaugirard; the most expensive locations are located at Elysée, Palais-Bourbon and Louvre. Furthermore, in recent years, Airbnb locations’ amount increases 102% in Paris, and locations’ average price does not change that much in general.
I shared this analysis on social networks, it attracted lots of readers and constructive ideas, which really encouraged me.
Second-hand apartments transactions in Paris
Since the 17th century, Paris has been one of Europe’s major centres of finance, diplomacy, commerce, fashion, science, and the arts. According to the Economist Intelligence Unit Worldwide Cost of Living Survey in 2018, Paris was the second most expensive city in the world, after Singapore, and ahead of Zürich, Hong Kong, Oslo and Geneva. Another source ranked Paris as most expensive, on a par with Singapore and Hong Kong, in 2018. All these elements help to bring the increasing price of real estate in Paris. Inspired by Airbnb Paris Analysis, I also analysed second-hand apartments transactions in Paris.
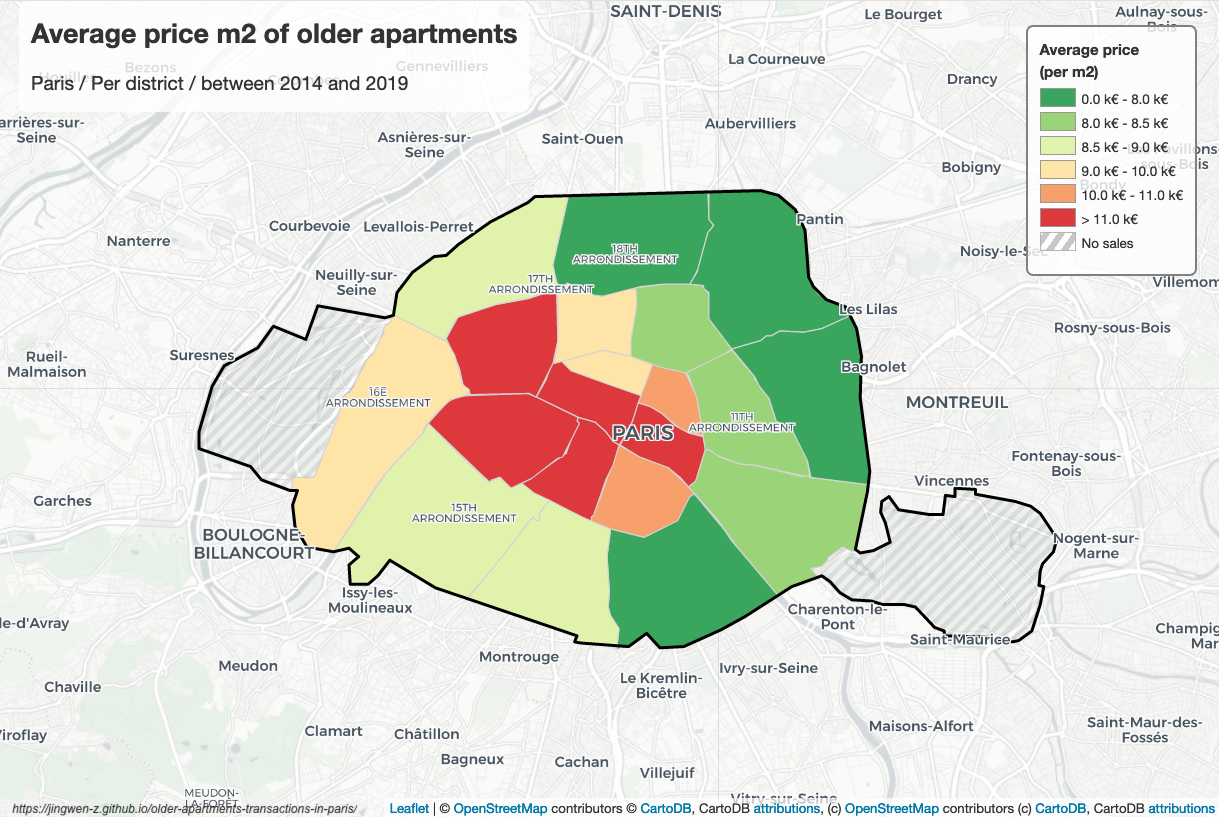
According to this analysis, we find that among all transactions of second-hand apartments in Paris, T1 and T2 hold 60% transactions. The second-hand apartments in districts 1, 4, 6, 7 and 8 are much more expensive than other districts, their average unit price is at least 11000 euros; on the contrary, the second-hand apartments in districts 13, 18, 19 and 20 are much cheaper than others, their average unit price is less than 8k euros.
Blogs
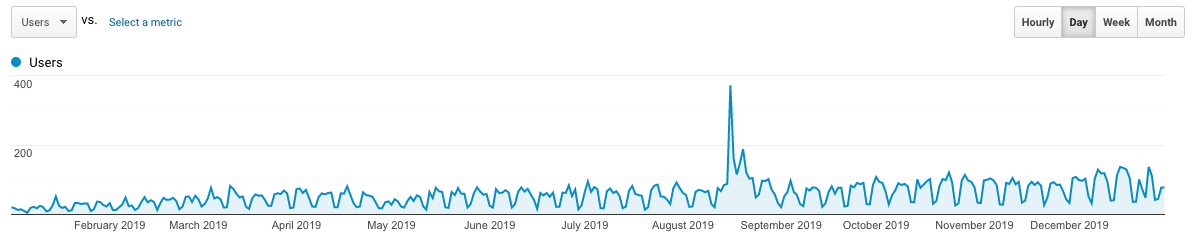
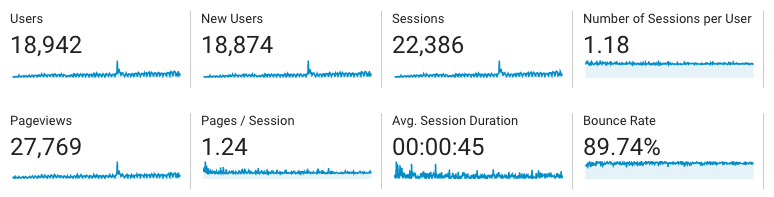
This year I wrote 33 blogs (yes, including this one), they talk about various topics: Data Visualisation, Machine Learning, Data Analysis, python application, database, performance, API, Excel, git and SQL. Moreover, the traffic of my blog increases nearly 870% with respect to 2018. I’m pretty glad if my blogs can help you and solve the problems for you.
Don’t hesitate if you want to ask questions or write comments, it’s welcome!!
Happy New Year! Hope to see you in 2020!
Reference
- “bibi!, bien plus qu’un programme de fidélité”, www.franprix.fr. [Online]. Available: https://www.franprix.fr/article/bibi-votre-nouveau-programme-d-avantages-clients_a25155/1
- “HEMA”, www.iamsterdam.com. [Online]. Available: https://www.iamsterdam.com/en/see-and-do/shopping/overview-department-stores/hema
- “HEMA s’installe dans vos magasins franprix”, www.franprix.fr. [Online]. Available: https://www.franprix.fr/article/hema-s-installe-dans-vos-magasins-franprix_a25648/1
- “DATA SCIENCE OLYMPICS 2019”, www.datascience-olympics.com. [Online]. Available: https://www.datascience-olympics.com/
- mohamed_hassan, “New year 2019 business man”, pixabay.com. [Online]. Available: https://pixabay.com/photos/new-year-2019-business-man-3357197/