A greenhouse gas (sometimes abbreviated GHG) is a gas that absorbs and emits radiant energy within the thermal infrared range. Greenhouse gases cause the greenhouse effect. The primary greenhouse gases in Earth’s atmosphere are water vapor, carbon dioxide, methane, nitrous oxide and ozone. Without greenhouse gases, the average temperature of Earth’s surface would be about −18 °C (0 °F), rather than the present average of 15 °C (59 °F). The atmospheres of Venus, Mars and Titan also contain greenhouse gases.
Human activities since the beginning of the Industrial Revolution (around 1750) have produced a 45% increase in the atmospheric concentration of carbon dioxide (CO2), from 280 ppm in 1750 to 415 ppm in 2019. This increase has occurred despite the uptake of more than half of the emissions by various natural “sinks” involved in the carbon cycle.
In this blog, I will talk about greenhouse gas emission with the following points:
- Greenhouse gas emission
- CO2 emission
Greenhouse gas emission
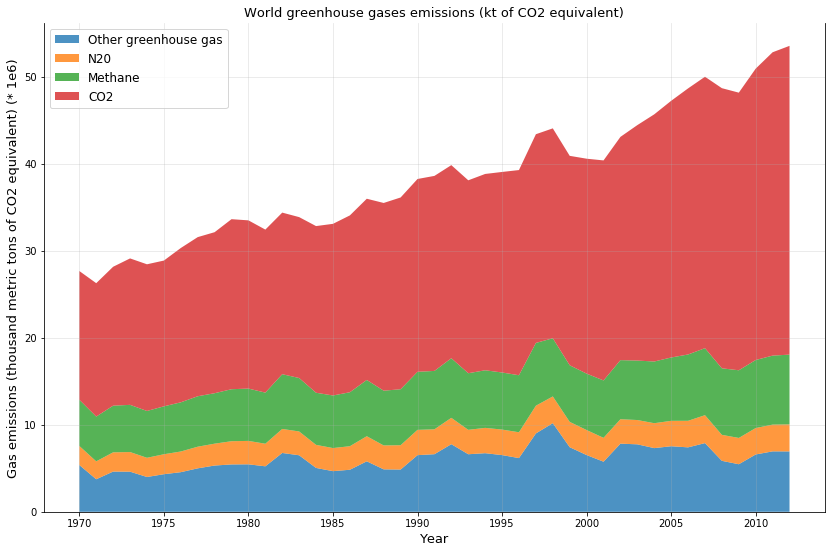
Greenhouse gases are those that absorb and emit infrared radiation in the wavelength range emitted by Earth. In order, the most abundant greenhouse gases in Earth’s atmosphere are: Water vapor (H2O), Carbon dioxide (CO2), Methane (CH4), Nitrous oxide (N2O), Ozone (O3), Chlorofluorocarbons (CFCs) and Hydrofluorocarbons (includes HCFCs and HFCs). Here, I have only emission data of greenhouse gas, CO2, Methane and Nitrous oxide.
The contribution of each gas to the greenhouse effect is determined by the characteristics of that gas, its abundance, and any indirect effects it may cause. For example, the direct radiative effect of a mass of methane is about 84 times stronger than the same mass of carbon dioxide over a 20-year time frame but it is present in much smaller concentrations so that its total direct radiative effect is smaller, in part due to its shorter atmospheric lifetime. On the other hand, in addition to its direct radiative impact, methane has a large, indirect radiative effect because it contributes to ozone formation. Shindell et al. (2005) argue that the contribution to climate change from methane is at least double previous estimates as a result of this effect.
It is not possible to state that a certain gas causes an exact percentage of the greenhouse effect. This is because some of the gases absorb and emit radiation at the same frequencies as others, so that the total greenhouse effect is not simply the sum of the influence of each gas. The higher ends of the ranges quoted are for each gas alone; the lower ends account for overlaps with the other gases. In addition, some gases, such as methane, are known to have large indirect effects that are still being quantified.
Now let’s look at the greenhouse gas emission. Greenhouse gas’s emission increased nearly 94% between 1970 and 2012, especially after 2001, it increased 33%. Among all greenhouse gas, CO2-emission quote-part is more than half of greenhouse gas emission, we’ll go deeper in the following part. However, the emission of Methane and Nitrous oxide didn’t increase that much. Since CO2’s emission is usually generated by burning fossil fuels, deforestation or biological respiration, and the emission of Methane and Nitrous oxide is caused by intestinal fermentation, combustion of organisms or fertilizer production, which are less frequency.
CO2 emission
Carbon dioxide in Earth’s atmosphere is a trace gas, at the mid 2018 having a global average concentration of 409 parts per million by volume (or 622 parts per million by mass). Atmospheric concentrations of carbon dioxide fluctuate slightly with the seasons, falling during the Northern Hemisphere spring and summer as plants consume the gas and rising during northern autumn and winter as plants go dormant or die and decay. Concentrations also vary on a regional basis, most strongly near the ground with much smaller variations aloft. In urban areas concentrations are generally higher and indoors they can reach 10 times background levels.
The concentration of carbon dioxide has risen due to human activities. Combustion of fossil fuels and deforestation have caused the atmospheric concentration of carbon dioxide to increase by about 43% since the beginning of the age of industrialization. Most carbon dioxide from human activities is released from burning coal and other fossil fuels. Other human activities, including deforestation, biomass burning, and cement production also produce carbon dioxide. Human activities emit about 29 billion tons of carbon dioxide per year, while volcanoes emit between 0.2 and 0.3 billion tons. Human activities have caused CO2 to increase above levels not seen in hundreds of thousands of years. Currently, about half of the carbon dioxide released from the burning of fossil fuels remains in the atmosphere and is not absorbed by vegetation and the oceans.
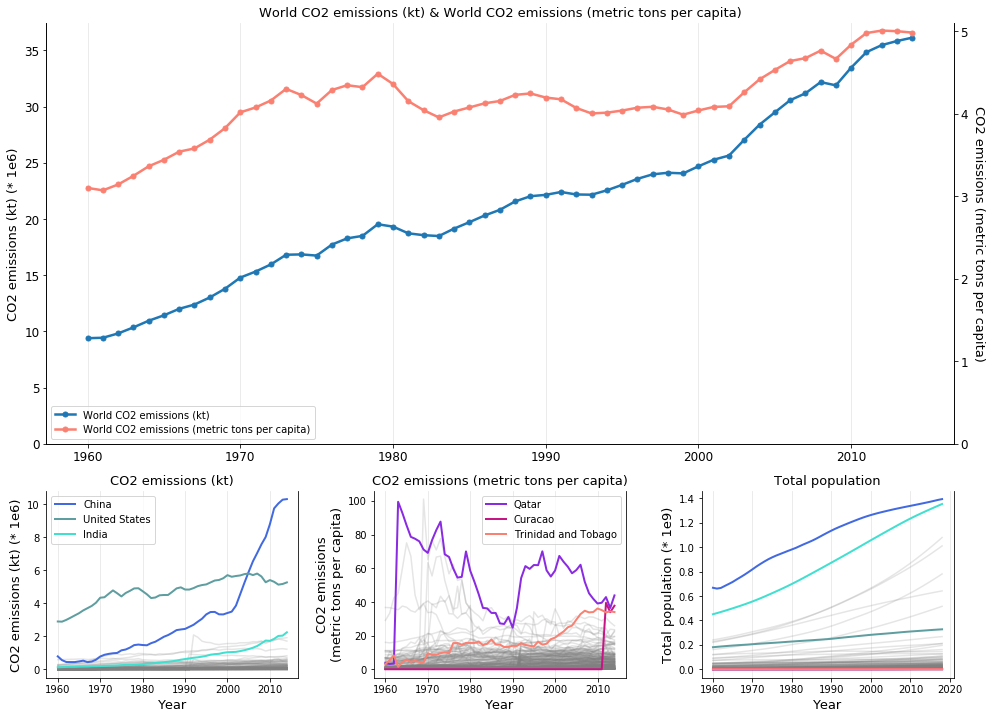
According to the graphs above, the world’s CO2 emission increases 285% from 1960 to 2014, especially after 2000, it increases 46%. The top 3 countries in 2014 are China, United States and India. For United States and India, their emissions increased gently; on the contrary, China’s CO2 emission exceeded United States and became the country whose CO2 emission is more than others. Between 2000 and 2014, China’s CO2 emission increases 200%, which corresponds the world’s emission curve.
Moreover, the world’s CO2 emission per capita increases 61% from 1960 to 2014, especially after 2000, it increases 22%. Similarly, I find out the top 3 countries are Qatar, Curacao and Trinidad and Tobago. Considering the population per country, we observe that these 3 countries have pretty small population, so it’s not difficult to understand why their CO2 emission per capita are more than other countries’.
(Yes, I only find data until 2014, it’s really a pity, if you have found open source data for recent years, it’s welcome!!)
Although we lack data of some countries or regions, we can still find that the CO2 emission doesn’t change a lot for almost countries or regions and their CO2 emission is not that much in general; except for China, United States and India, which correspond to the line charts above.
China
In recent decades, China has suffered from severe environmental deterioration and pollution. While regulations such as the 1979 Environmental Protection Law are fairly stringent, they are poorly enforced, as they are frequently disregarded by local communities and government officials in favor of rapid economic development. Urban air pollution is a severe health issue in the country; the World Bank estimated in 2013 that 16 of the world’s 20 most-polluted cities are located in China. And China is the country with the highest death toll because of air pollution. There are 1.14 million deaths caused by exposure to ambient air pollution. China is the world’s largest carbon dioxide emitter. The country also has significant water pollution problems: 40% of China’s rivers had been polluted by industrial and agricultural waste by late 2011. In 2014, the internal freshwater resources per capita of China reduced to 2,062m3, and it was below 500m3 in the North China Plain, while 5,920m3 in the world.
However, China is the world’s leading investor in renewable energy and its commercialization, with $52 billion invested in 2011 alone; it is a major manufacturer of renewable energy technologies and invests heavily in local-scale renewable energy projects. By 2015, over 24% of China’s energy was derived from renewable sources, while most notably from hydroelectric power: a total installed capacity of 197 GW makes China the largest hydroelectric power producer in the world. China also has the largest power capacity of installed solar photovoltaics system and wind power system in the world. In 2011, the Chinese government announced plans to invest four trillion yuan (US$619 billion) in water infrastructure and desalination projects over a ten-year period, and to complete construction of a flood prevention and anti-drought system by 2020. In 2013, China began a five-year, US$277 billion effort to reduce air pollution, particularly in the north of the country.
United States
The United States is the second largest contributor of carbon dioxide in the world, releasing nearly 15% of global emissions. US residents emit approximately 16.5 metric tons of carbon dioxide per capita every year.
The states like Wyoming, North Dakota and West Virginia produce high level of CO2 emission. Wyoming is the second largest producer of electricity in the country and it has a high energy intensity rating, which means it has a high amount of energy consumed per gross domestic product. These factors work together to give Wyoming the highest per capita carbon dioxide emission rate in the country. North Dakota also has a high energy intensity rating, and it experiences extremely cold winters, which creates an increased demand for heating and energy. For West Virginia, one of the factors contributing to this high rate is the state’s reliance on fossil fuels to produce energy. Approximately 98% of its energy comes from the following fossil fuels: coal (77%), natural gas (12.8%), and oil (8.6%).
Conclusion
Should greenhouse gas emissions continue at their rate in 2019, global warming could cause Earth’s surface temperature to exceed historical values as early as 2047, with potentially harmful effects on ecosystems, biodiversity and human livelihoods. At current emission rates, temperatures could increase by 2 °C, which the United Nations’ IPCC designated as the upper limit to avoid “dangerous” levels, by 2036.
You can find all codes in this notebook.
Reference
- “Climate Change”, data.worldbank.org. [Online]. Available: https://data.worldbank.org/topic/climate-change?end=2018&start=1973
- “Greenhouse gas”, wikipedia.org. [Online]. Available: https://en.wikipedia.org/wiki/Greenhouse_gas
- “Carbon dioxide”, wikipedia.org. [Online]. Available: https://en.wikipedia.org/wiki/Carbon_dioxide
- “China Environmental issues”, wikipedia.org. [Online]. Available: https://en.wikipedia.org/wiki/China#Environmental_issues
- “US States By Carbon-Dioxide Emissions Per Capita”, worldatlas.com. [Online]. Available: https://www.worldatlas.com/articles/us-states-by-carbon-dioxide-emissions-per-capita.html
- “Cloud sky technology white skyline sunlight”, pxhere.com. [Online]. Available: https://pxhere.com/en/photo/1136652