World energy consumption is the total energy produced and used by the entire human civilization. Typically measured per year, it involves all energy harnessed from every energy source applied towards humanity’s endeavors across every single industrial and technological sector, across every country. It does not include energy from food, and the extent to which direct biomass burning has been accounted for is poorly documented. Being the power source metric of civilization, world energy consumption has deep implications for humanity’s socio-economic-political sphere.
In this blog, I will talk about energy consumption with the following points:
- Electric power consumption (kWh per capita)
- Energy use (kg of oil equivalent per capita)
Electric power consumption (kWh per capita)
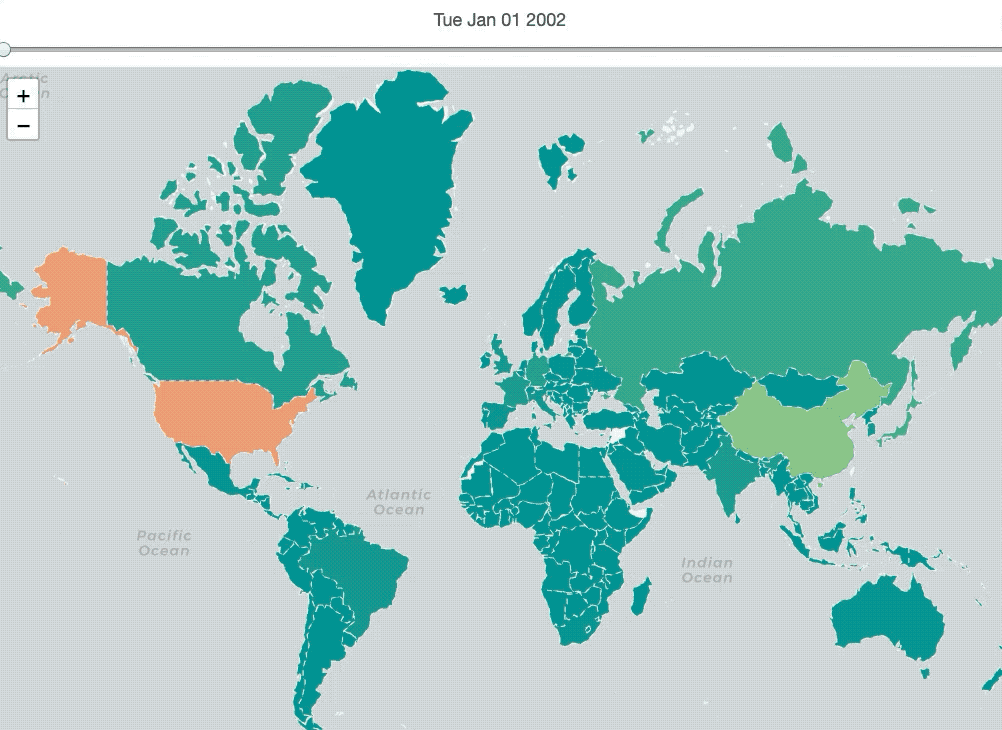
Although we lack data of some countries or regions, we can still find that the electric power consumption doesn’t change a lot for almost countries or regions and their electric power consumption is not that much in general; except for China and the United States.
China
China’s electric power industry is the world’s largest electricity producer, passing the United States in 2011 after rapid growth since the early 1990s. Most of the electricity in China comes from coal, which accounted for 66% of the electricity generation mix in 2016. Coal-fired electricity production declined from 2013 to 2016 coinciding with a major boom in renewable energy, and a decline in GDP growth.
In recent history, China’s power industry is characterized by fast growth and an enormous installed base. In 2014, it had the largest installed electricity generation capacity in the world with 1505 GW and generated 5583 TWh China also has the largest thermal power capacity, the largest hydropower capacity, the largest wind power capacity and the largest solar capacity in the world. Despite an expected rapid increase in installed capacity scheduled in 2014 for both wind and solar, and expected increase to 60 GW in nuclear by 2020, coal will still account between 65% and 75% of capacity in 2020.
China is the largest producer and consumer of coal in the world and is the largest user of coal-derived electricity. However, since 2014 coal as a percentage of the energy mix has fallen, declining from 64% in 2015 to 62% in 2016 according to the National Bureau of Statistics. Hydroelectricity is currently China’s largest renewable energy source and the second overall after coal. China’s installed hydro capacity in 2015 was 319 GW, up from 172 GW in 2009, including 23 GW of pumped storage hydroelectricity capacity. In 2015, hydropower generated 1126 TWh of power, accounting for roughly 20% of China’s total electricity generation.
With its large land mass and long coastline, China has exceptional wind resources: it is estimated China has about 2380 GW of exploitable capacity on land and 200 GW on the sea. At the end of 2014, there was 114 GW of electricity generating capacity installed in China, more than the total nameplate capacity of China’s nuclear power stations, (although capacity of wind power is not on par with capacity of nuclear power) and over the year 115000 gigawatt-hours of wind electricity had been provided to the grid. In 2011, China’s plan was “to have 100 gigawatts (GW) of on-grid wind power generating capacity by the end of 2015 and to generate 190 billion kilowatt hours (kWh) of wind power annually”. China has identified wind power as a key growth component of the country’s economy; researchers from Harvard and Tsinghua University have found that China could meet all of their electricity demands from wind power through 2030.
In terms of nuclear power generation, China will advance from the moderate development strategy to accelerating development strategy. Nuclear power will play an even more important role in China’s future power development. Especially in the developed coastal areas with heavy power load, nuclear power will become the backbone of the power structure there. China is the world’s largest market for both photovoltaics and solar thermal energy. Since 2013 China has been the world’s leading installer of solar photovoltaics. Solar PV in China is a growing industry with over 400 companies. In 2015, China became the world’s largest producer of photovoltaic power, narrowly surpassing Germany. Of the 6412 TWh electricity produced in China in 2017, 118.2 TWh was generated by solar power, equivalent to 1.84% of total electricity production.
US
The United States is the world’s second largest producer and consumer of electricity. It consumes about 20% of the world’s electricity supply.
The United States has an installed summer electricity generation capacity of 1072.46 GW in 2017, down 1.8 GW from 2016. The US electricity generation was 4034.3 TWh in 2017. The US’s net imports were 56.31 TWh, for a total of 4090.6 TWh of electrical energy use. Electrical energy generated from coal was 1205.84 TWh (29.48%); natural and other gases, 1308.89 TWh (32.0%); nuclear, 804.95 TWh (19.68%); hydro, 300.33 TWh (7.34%); Renewables (other than hydro), 386.28 TWh (9.45%); imports less exports, 56.31 TWh (1.38%); petroleum, 21.39 TWh (0.52%); and miscellaneous (including pumped storage), 6.59 TWh (0.16%). The US’s renewable sources (hydro reported separately) are wind, 254.30 TWh (6.22%); wood, 41.15 TWh (1.01%); other biomass, 21.61 TWh (0.53%); geothermal, 15.93 TWh (0.39%) and solar, 53.29 TWh (1.3%). Small-scale solar is estimated to have produced an additional 23.99 TWh. Natural gas electricity generation exceeded generation from coal for the first time in 2016 and continued in 2017.
Renewable energy in the United States accounted for 13.2% of the domestically produced electricity in 2014, and 11.2% of total energy generation. Renewable energy reached a major milestone in the first quarter of 2011, when it contributed 11.7% of total US energy production, surpassing nuclear energy production. Hydroelectric power is currently the largest producer of renewable energy in the US. It produced around 6.2% of the nation’s total electricity in 2010 which was 60.2% of the total renewable energy in the US. The United States is the fourth largest producer of hydroelectricity in the world after China, Canada, and Brazil. US wind power’s installed capacity now exceeds 65000 MW and supplies 4% of the nation’s electric power. The United States has some of the largest solar farms in the world. Solar Star is a 579-megawatt (MWAC) farm near Rosamond, California.
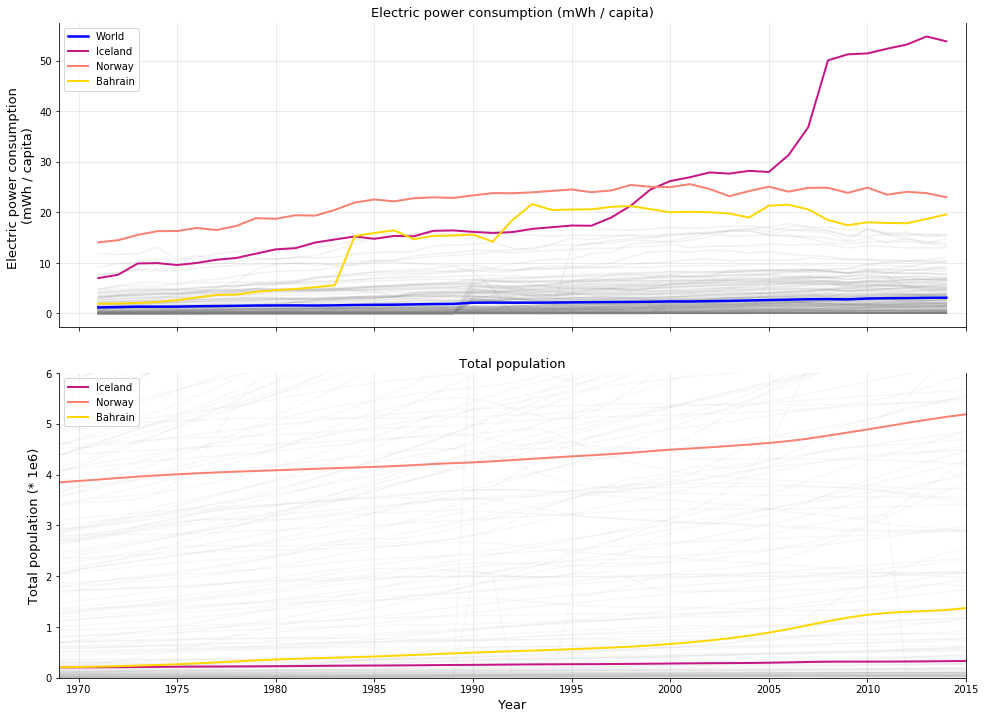
The world’s electric power consumption(kWh per capita) increases 161%(1200.1 kWh to 3132.1 kWh) respectively between 1971 and 2014. For the electric power consumption(kWh per capita), the top 3 countries are Iceland, Norway and Bahrain. Considering it’s the value per capita, so one reason why they are the “top 3” is their population is lower than others, which increases consumption per capita.
Iceland
Renewable sources—geothermal and hydropower—provide effectively all of Iceland’s electricity and around 85% of the nation’s total primary energy consumption, with most of the remainder consisting of imported oil products used in transportation and in the fishing fleet. Iceland expects to be energy-independent by 2050. Iceland’s largest geothermal power plants are Hellisheiði and Nesjavellir, while Kárahnjúkar Hydropower Plant is the country’s largest hydroelectric power station. When the Kárahnjúkavirkjun started operating, Iceland became the world’s largest electricity producer per capita. Iceland is one of the few countries that have filling stations dispensing hydrogen fuel for cars powered by fuel cells. It is also one of a few countries currently capable of producing hydrogen in adequate quantities at a reasonable cost, because of Iceland’s plentiful renewable sources of energy.
Norway
Hydropower generation capacity is around 31 GW in 2014, when 131 TWh was produced; about 95% of total production. Of the total production in 2011 of 128 TWh; 122 TWh was from hydroelectric plants, 4795 GWh was from thermal power, and 1283 GWh was wind generated. In the same year, the total consumption was 114 TWh. Hydro production can vary 60 TWh between years, depending on the amount of precipitation, and the remaining hydro potential is about 34 TWh.
The annual electricity consumption was about 26-27 MWh per inhabitant during 2004-2009 when the European Union (EU15) average in 2008 was 7.4 MWh. Norway’s consumption of electricity was over three times higher per person compared to the EU 15 average in 2008. The domestic electricity supply promotes use of electricity, and it is the most common energy source for heating floors and hot water.
Bahrain
Bahrain could provide itself completely with self-produced energy. The total production of all electric energy producing facilities is 27 bn kWh, which is 103% of the countries own usage. Despite this, Bahrain is trading energy with foreign countries. Along with pure consumption the production, imports and exports play an important role. Other energy sources such as natural gas or crude oil are also used.
Energy use (kg of oil equivalent per capita)
Similar as the electric power consumption, we can find that the energy use doesn’t change a lot for almost countries or regions and their energy use is not that much in general; except for China and the United States.
China
Ensuring adequate energy supply to sustain economic growth has been a core concern of the Chinese government since 1949. Primary energy use in China was 26250 TWh and 20 TWh per million persons in 2009. According to the International Energy Agency, the primary energy use grew 40% from 2004 to 2009.
The energy import was three times bigger in 2009 compared to 2004. The share of energy import of the primary energy use was 12% in 2009. China is also the world’s largest renewable energy producer. China is the largest producer of hydroelectricity, solar power and wind power in the world.
In the industrial sector, six industries – electricity generation, steel, non-ferrous metals, construction materials, oil processing and chemicals – account for nearly 70% of energy use.
Coal remains the foundation of the Chinese energy system, covering close to 70 percent of the country’s primary energy needs and representing 80 percent of the fuel used in electricity generation. China is the world’s top coal producer and ranks third in the amounts of coal reserves. China consumes more coal than any other country. Analysis in 2016 shows that China’s coal consumption appears to have peaked in 2014.
US
The United States was the second-largest energy consumer in 2010 after China. The country is ranked seventh in energy consumption per capita after Canada and several small nations. Not included is the significant amount of energy used overseas in the production of retail and industrial goods consumed in the United States.
Most of this energy comes from fossil fuels: in 2010, data showed that 25% of the nation’s energy originates from petroleum, 22% from coal, and 22% from natural gas. Nuclear energy supplied 8.4% and renewable energy supplied 8%, mainly from hydroelectric dams and biomass; however, this also includes other renewable sources like wind, geothermal, and solar. As of 2006, energy consumption had increased more rapidly than domestic energy production over the last 50 years in the nation (when they were roughly equal). This difference was largely met through imports.
Oil is one of the largest sources of energy in the United States. The United States influences world oil reserves for both growth and development. As the 20th century progressed, petroleum gained increasing importance by providing heating and electricity to the commercial and industrial sectors. Oil was also used in transportation; first for railroads and later for motor vehicles.
Natural gas was the largest source of energy production in the United States in 2016, representing 33% of all energy produced in the country. Natural gas has been the largest source of electrical generation in the United States since July 2015.
Generation of electricity is the largest user of coal, although its use is in decline. About 50% of electric power was produced by coal in 2005, declining to 30% in 2016. Electric utilities buy more than 90% of the coal consumed in the United States.
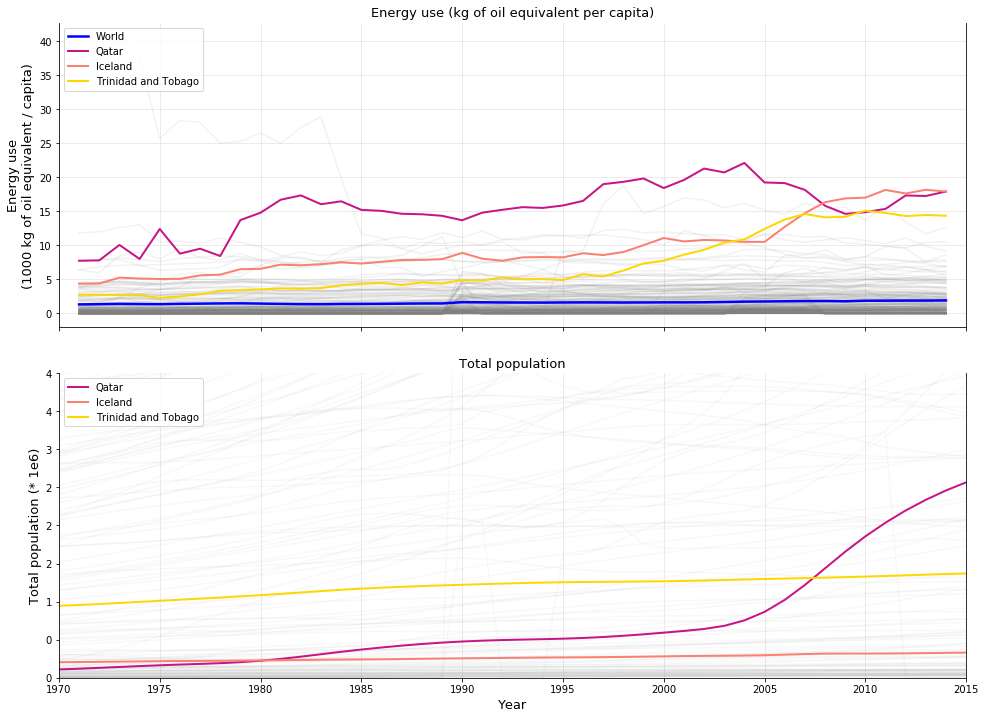
The world’s energy use(kg of oil equivalent per capita) increases 44%(1337 kg to 1922.5 kg) respectively between 1971 and 2014. For the energy use(kg of oil equivalent per capita), the top 3 countries are Qatar, Iceland and Trinidad and Tobago. Considering it’s the value per capita, so one reason why they are the “top 3” is their population is lower than others, which increases consumption per capita.
Qatar
Since 2007, natural gas production in Qatar has significantly increased and is the primary fuel chosen for energy consumption within Qatar. In 2014, Qatar ranked as the fourth highest natural gas producer worldwide. In 2015, Qatar was ranked as the 17th top producer of crude oil worldwide at an approximate 1.532 million bbl/day. In 2013, Qatar also ranked as the 11th top exporter of crude oil at an approximate 1.303 million bbl/day. With high production of crude oil, Qatar is one of the few countries that has little crude oil dependence on other countries for domestic energy consumption.
In 2009, Qatar was the 7th top producer of natural gas (2.9%) in the world, 75% of the natural gas production was exported in 2009 (67/89 bm3).
Harnessing solar power has become an important objective for Qatar in recent years. By 2030, Qatar has set the goal of attaining 20% of its energy from solar power. The country is well-positioned to capitalize on photovoltaic systems, as it has a global horizontal irradiance value of approximately 2140 kWh per square meter annually. Furthermore, the direct irradiance parameter is roughly 2008 kWh per square meter annually, implying that it would be able to benefit from concentrated solar power as well.
Iceland
About 85% of the total primary energy supply in Iceland is derived from domestically produced renewable energy sources. This is the highest share of renewable energy in any national total energy budget. In 2013 Iceland became a producer of wind energy. In 2015, renewable energy provided almost 100% of electricity production, with about 73% coming from hydropower and 27% from geothermal power. In 2016 geothermal energy provided about 65% of primary energy, the share of hydropower was 20%, and the share of fossil fuels (mainly oil products for the transport sector) was 15%.[1] The main use of geothermal energy is for space heating, with the heat being distributed to buildings through extensive district-heating systems. About 85% of all houses in Iceland are heated with geothermal energy.
Trinidad and Tobago
Trinidad and Tobago is the region’s leading exporter of oil and gas but imports of fossil fuels provided over 90% of the energy consumed by its CARICOM neighbours in 2008.
Renewable energies include wind, solar, biomass and geothermal energy sources. This means all energy sources that renew themselves within a short time or are permanently available. Energy from hydropower is only partly a renewable energy. This is certainly the case with river or tidal power plants. Otherwise, numerous dams or reservoirs also produce mixed forms, e.g. by pumping water into their reservoirs at night and recovering energy from them during the day when there is an increased demand for electricity. Since it is not possible to clearly determine the amount of generated energy, all energy from hydropower are displayed separately.
Conclusion
We use electricity and energy everyday in our life. It’s really important to optimise energy consumption. What can we do? We can make a habit of turning off all lights and electronics when not in use; switch your incandescent lightbulbs to LED bulbs; use power strips for multiple gadgets; turn off your computer when it’s not in use; adjust your thermostat based on the temperature outside; recycle all recyclable materials or decorate your space in light colors, etc.
You can find all codes in this notebook.
Reference
- “Climate Change”, data.worldbank.org. [Online]. Available: https://data.worldbank.org/topic/climate-change?end=2018&start=1973
- “World energy consumption”, wikipedia.org. [Online]. Available: https://en.wikipedia.org/wiki/World_energy_consumption
- “Electricity sector in China”, wikipedia.org. [Online]. Available: https://en.wikipedia.org/wiki/Electricity_sector_in_China
- “Energy in the United States”, wikipedia.org. [Online]. Available: https://en.wikipedia.org/wiki/Energy_in_the_United_States#Electricity
- “Iceland Energy”, wikipedia.org. [Online]. Available: https://en.wikipedia.org/wiki/Iceland#Energy
- “Electricity sector in Norway”, wikipedia.org. [Online]. Available: https://en.wikipedia.org/wiki/Electricity_sector_in_Norway
- “Bahrain energy consumption”, worlddata.info. [Online]. Available: https://www.worlddata.info/asia/bahrain/energy-consumption.php
- “Energy policy of China”, wikipedia.org. [Online]. Available: https://en.wikipedia.org/wiki/Energy_policy_of_China
- “Energy in Qatar”, wikipedia.org. [Online]. Available: https://en.wikipedia.org/wiki/Energy_in_Qatar
- “Renewable energy in Iceland”, wikipedia.org. [Online]. Available: https://en.wikipedia.org/wiki/Renewable_energy_in_Iceland
- “Trinidad and Tobago”, wikipedia.org. [Online]. Available: https://en.wikipedia.org/wiki/Trinidad_and_Tobago
- “Trinidad and Tobago energy consumption”, worlddata.info. [Online]. Available: https://www.worlddata.info/america/trinidad-and-tobago/energy-consumption.php
- “How to Reduce Your Energy Consumption”, wikihow.com. [Online]. Available: https://www.wikihow.com/Reduce-Your-Energy-Consumption
- ColiN00B, “Light bulb idea creativity socket”, pixabay.com. [Online]. Available: https://pixabay.com/photos/light-bulb-idea-creativity-socket-3104355/