Paris is the capital and most populous city of France, and it also attracts lots of tourists, which makes me eager to dig out Airbnb locations in Paris. Where are the locations located? What are their prices? In this blog, I will analyse Airbnb Paris with the following points:
- Data description
- Locations on the map
- What type of room are they?
- What are the neighbourhood of locations?
- Average price for each neighbourhood?
- Location amount in time series
- Location amount in different neighbourhood (heatmap)
- Average location price in different neighbourhood
- Reference
Data description
I firstly analyse only with data of 9th, July 2019, which is the most recent at this moment.
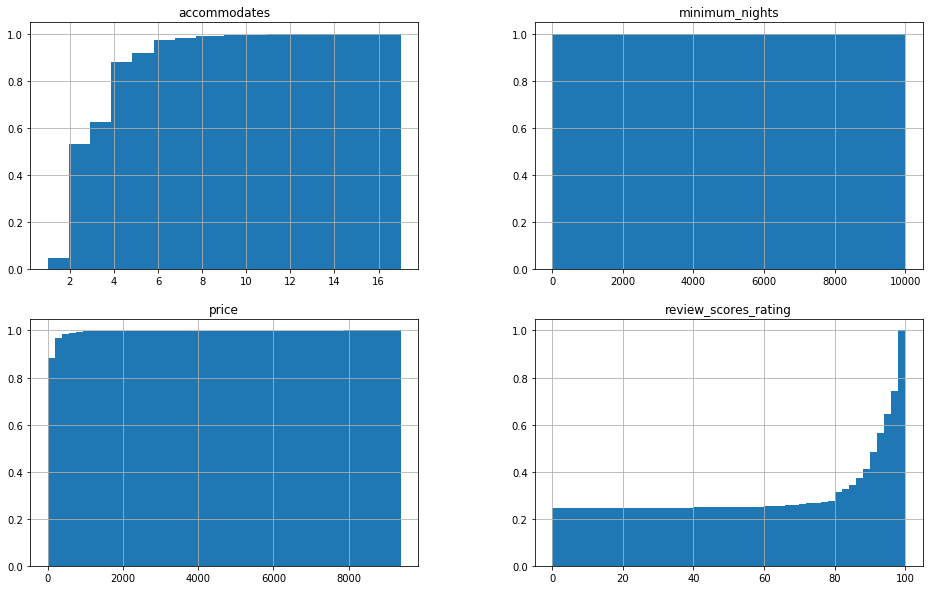
According to the histograms above, we find that in Paris 50% locations are able to accommodate at least 2 persons, the review scores rating is 100/100 for 18% locations, nearly 50% locations need clients to reserve at least 2 nights. Moreover, the most important point, the price of one night is less than $80 for 50% locations.
In the second part, I’ll apply historical data to do some further analysis.
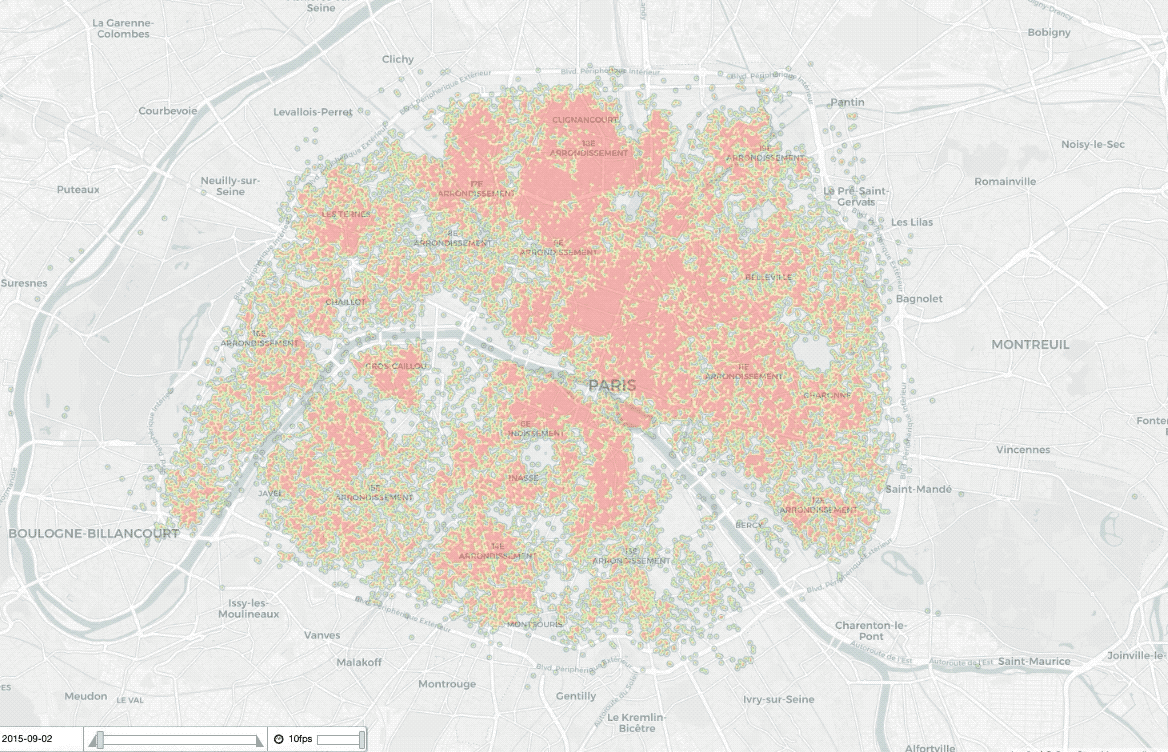
Locations on the map
What type of room are they?
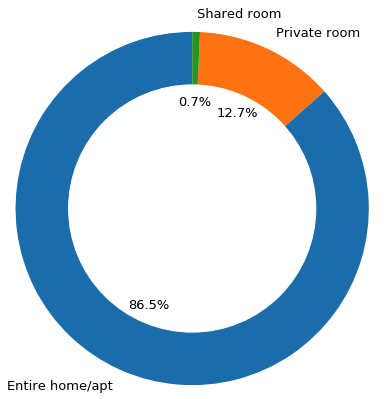
In Paris, 86.5% of Airbnb locations are entire home/apartment, nearly 13% are private room, the rest are shared room.
What are the neighbourhood of locations?
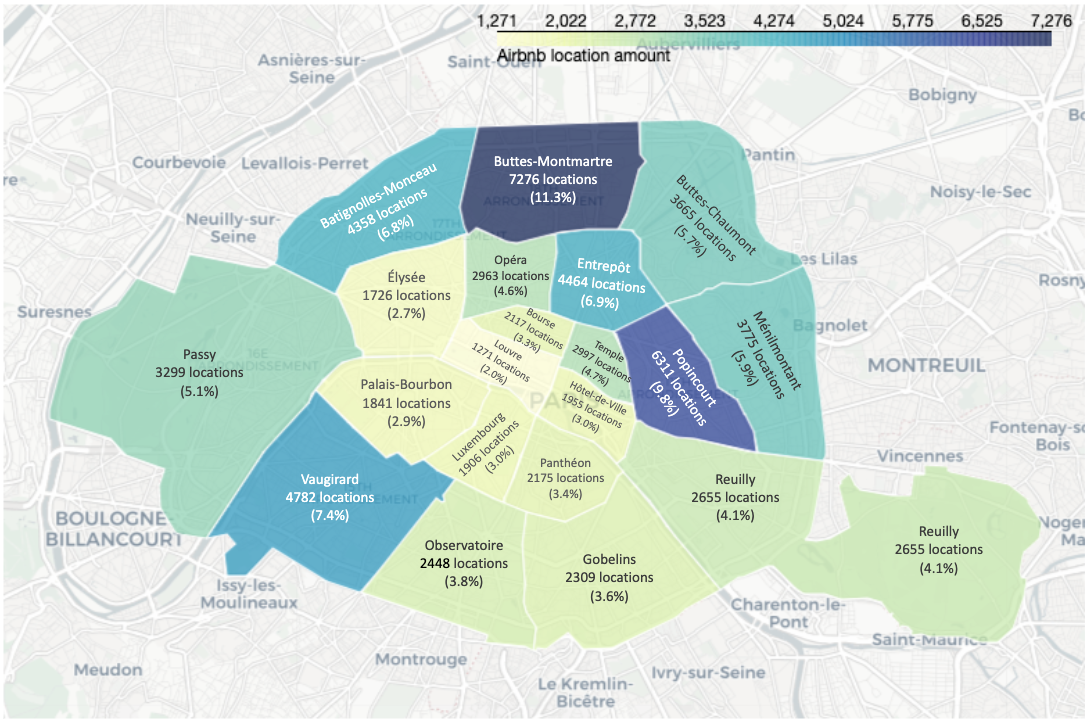
The top 3 neighbourhood are Buttes-Montmartre (11.3%), Popincourt (9.8%) and Vaugirard (7.4%), the flop 3 neighbourhood are Louvre, Elysée and Palais-Bourbon, which might because the real estate is much more expensive in these quarters, and there are less apartment to be sold, people who purchase real estate for renting is less than other quarters.
Average price for each neighbourhood?
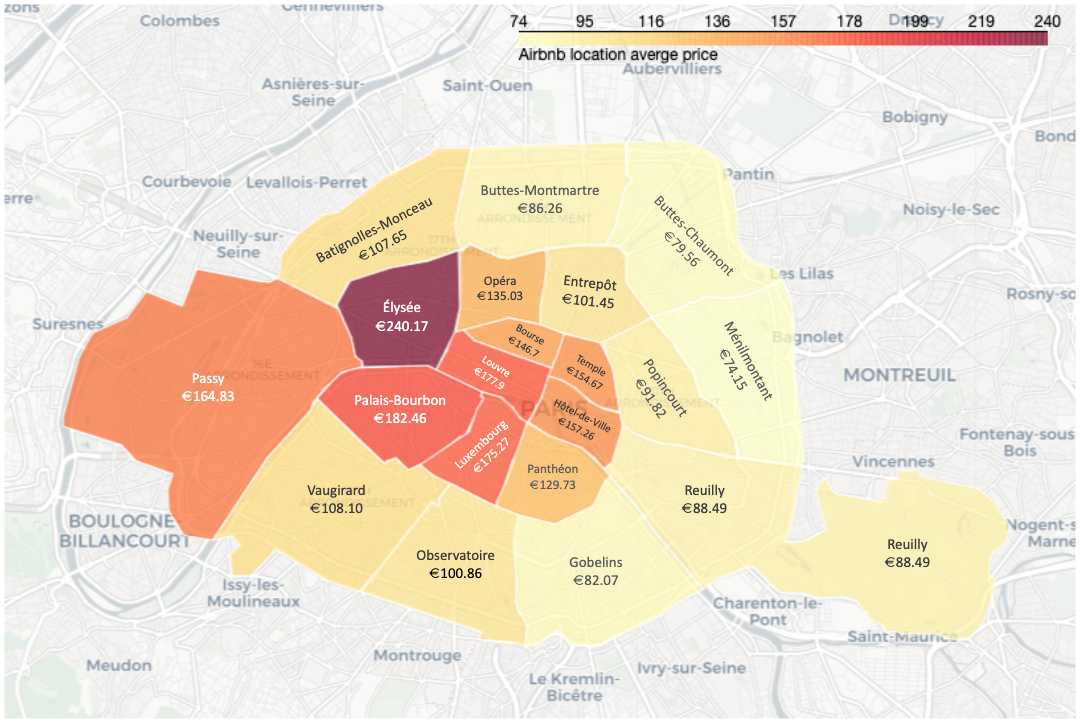
It’s a pity that we don’t know the area for each location, we cannot calculate the price for each m2. However, we calculate the average price for different neighbourhood.
The top 3 neighbourhood are Elysée (240 euros), Palais-Bourbon (182 euros) and Louvre (178 euros), the flop 3 neighbourhood are Ménilmontant, Buttes-Chaumont and Gogelins, which might be because of the neighbourhood security, quality, etc. We find an interesting point: the price and locations’ amount is negatively related, which means the better neighbourhood has less Airbnb locations and its price is more expensive than others.
Locations in Time Series
Location amount in time series
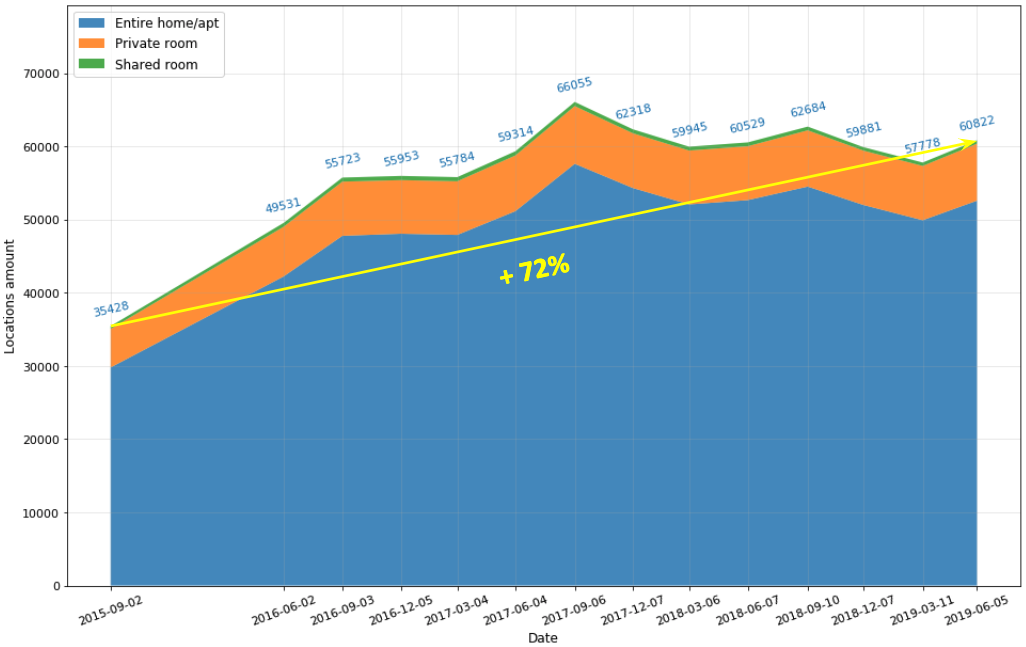
From May 2015 to July 2019, Airbnb locations’ amount increases 102% (64293/29212) in Paris, especially between May 2015 and July 2016, it increases 80% (52725/29212), most of them are “Entire home/apt”. Considering the real estate prices in Paris, the “Entire home/apt” might means a studio or a two-room apartment (1 living room + 1 bedroom). Moreover, for recent years, the peaks of locations’ amount are in the month of April or July / August, which reflects the season.
Average location price in different neighbourhood
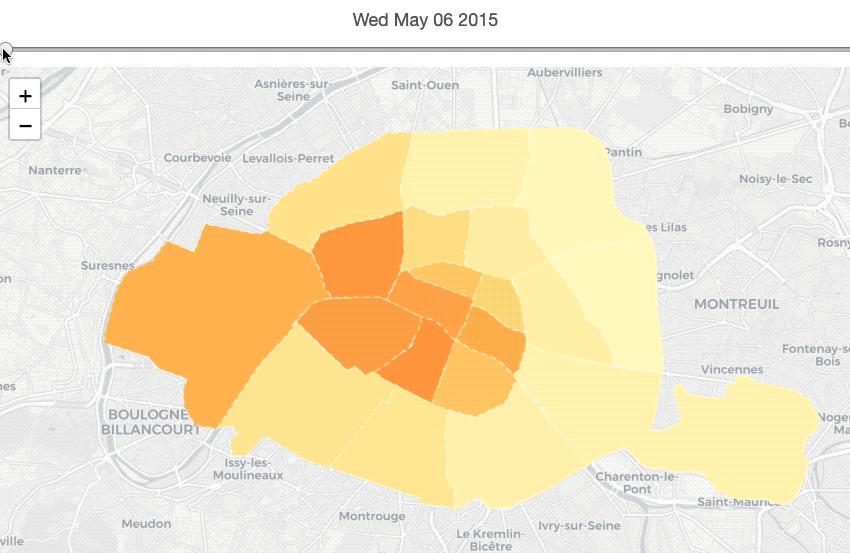
Globally, locations’ average price does not change that much. Except for the locations at Elysée, Temple and Opéra, whose price increase 53%, 35% and 26%, respectively.
Conclusion
According to this analysis, we find that the majority of Airbnb locations in Paris are entire home/apartment; most of the locations are location at Buttes-Montmartre, Popincourt and Vaugirard; the most expensive locations are located at Elysée, Palais-Bourbon and Louvre. Furthermore, in recent years, Airbnb locations’ amount increases 102% in Paris, and locations’ average price does not change that much in general.
You can find all codes in this notebook.
Reference
- “Inside Airbnb”, insideairbnb.com. [Online]. Available: http://insideairbnb.com/get-the-data.html
- folium, “plugin-Search”, github/python-visualization/folium. [Online]. Available: https://nbviewer.jupyter.org/github/python-visualization/folium/blob/master/examples/plugin-Search.ipynb
- folium, “colormaps”, github/python-visualization/folium. [Online]. Available: https://nbviewer.jupyter.org/github/python-visualization/folium/blob/master/examples/Colormaps.ipynb