Recently, lots of European countries started to stop the lockdown. Thus, I’m curious about the actual COVID-19 situation around the world. In this blog, I will talk about the worldwide COVID-19 pandemic in the following points:
- COVID-19 pandemic in China
- Worldwide confirmed cases
- Daily cumulative confirmed count for each country
- COVID-19 pandemic spreads of TOP 10 countries
COVID-19 pandemic in China
Since around 20 February, the confirmed cases started to be stable in China, daily cured count started to be greater than daily new cases in all provinces. Moreover, it seems that there was a small return in April.
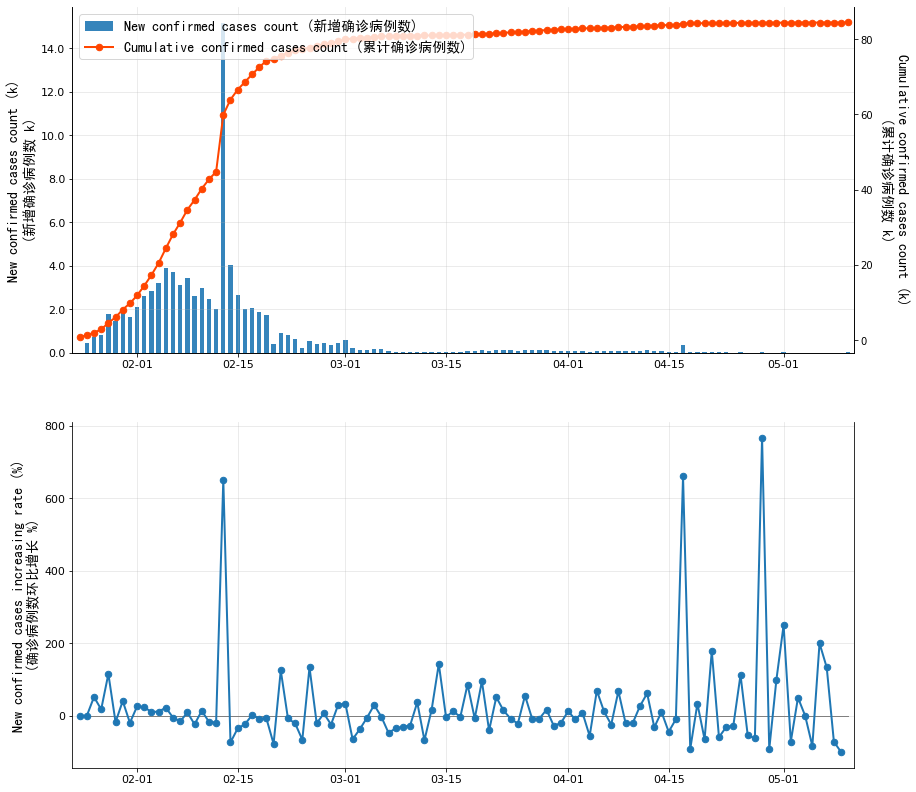
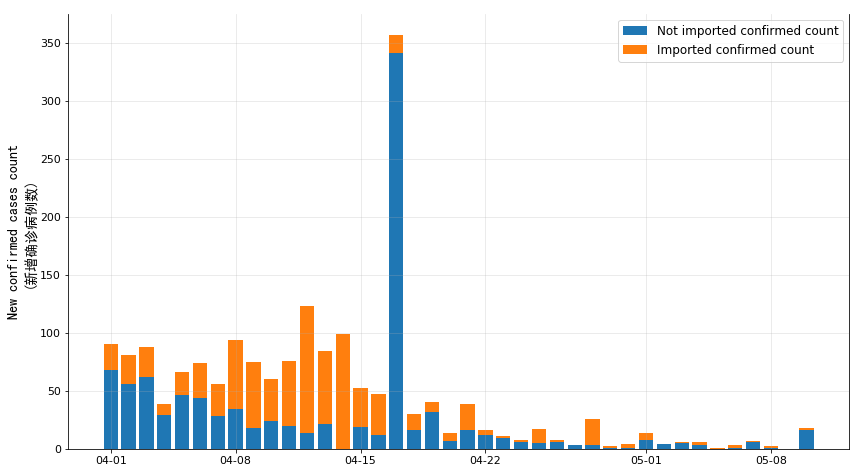
We can say the peak for the first stage has reached at the late of February, the daily increasing cases have reached its low point at 12 March which has 12 new cases. Then the daily new cases started to increase, there are various reasons, such as people returned to their workplaces so that the traffic or passengers started to increase in public places; moreover, lots of people who study or work abroad back to China, they were infected on their way to China.
Worldwide confirmed cases
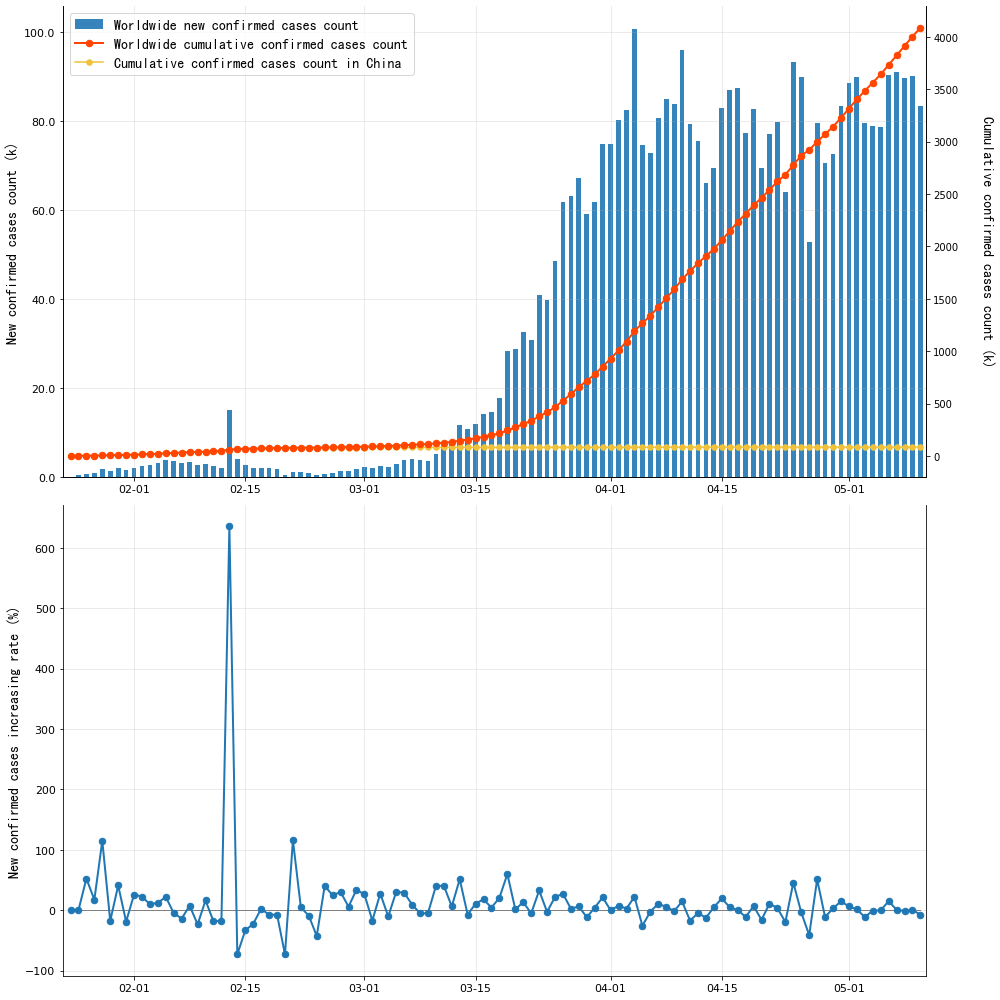
According to this graph, we find that since around 22 February, COVID-19 in China began to be stable, but it propagates in the Rest of World. As of 10 May, there were more than 4 million cases of COVID-19. The new confirmed evolution per day is decreased to about 20% for the whole world.
Daily cumulative confirmed count for each country
COVID-19 pandemic spreads of TOP 10 countries
Cumulative number of confirmed cases, by number of days since 30th case
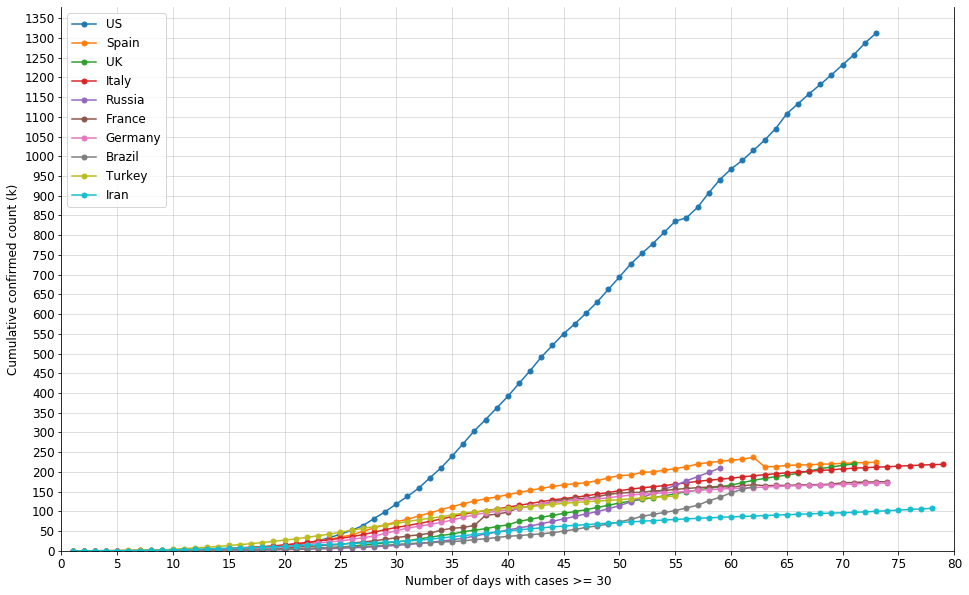
This plot describes the daily cumulative confirmed count for each country since the confirmed count arrived at 30 cases. Here we need to highlight some countries:
- US: the confirmed cases in the US are always greater than others.
- European countries: the increasing of confirmed cases in Europe started to be less aggressive. Hope it’s the beginning of the brightening. You might ask why is there a decreasing on the curve of Spain? That’s because Spain decided to update their method of diagnoses, so that they had over-diagnosed the confirmed cases.
Cumulative number of confirmed cases per 1 million people, by number of days since 30th case
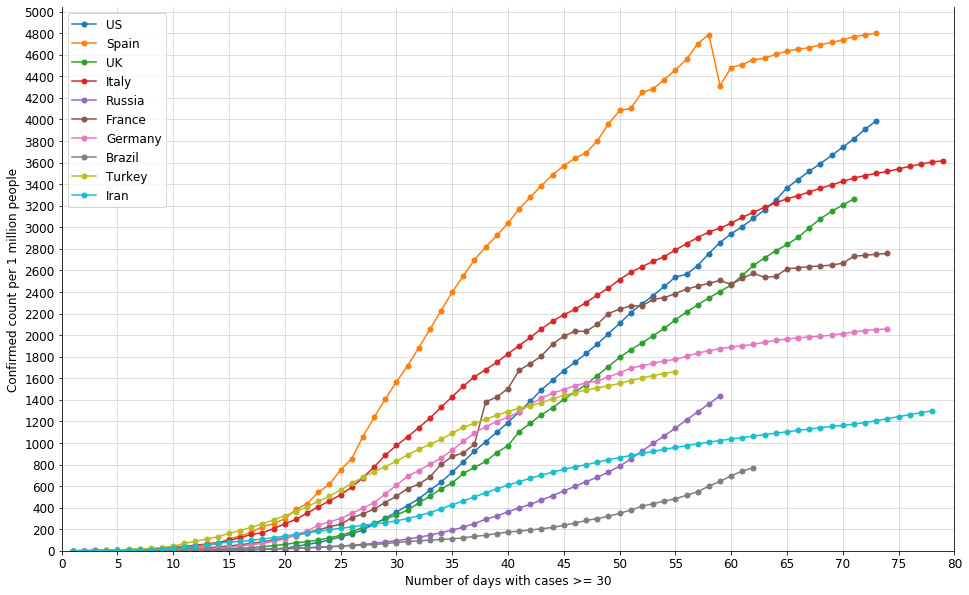
This plot describes the daily cumulative confirmed count per 1 million people for each country since the confirmed count arrived at 30 cases. Here we need to highlight some countries:
- European countries: as of 10 May, the confirmed cases per 1 million people are greater than other countries, but it trends to be stable, like other European countries.
- US: although its confirmed cases per 1 million people is lower than Spain, if the US keeps this increasing speed, it’s not far to be the greatest.
- UK, Russia & Brazil: we should also pay attention to these three countries, since their confirmed cases per 1 million people has already been increased for several days.
Cumulative deaths rate, by number of days since 20 deaths
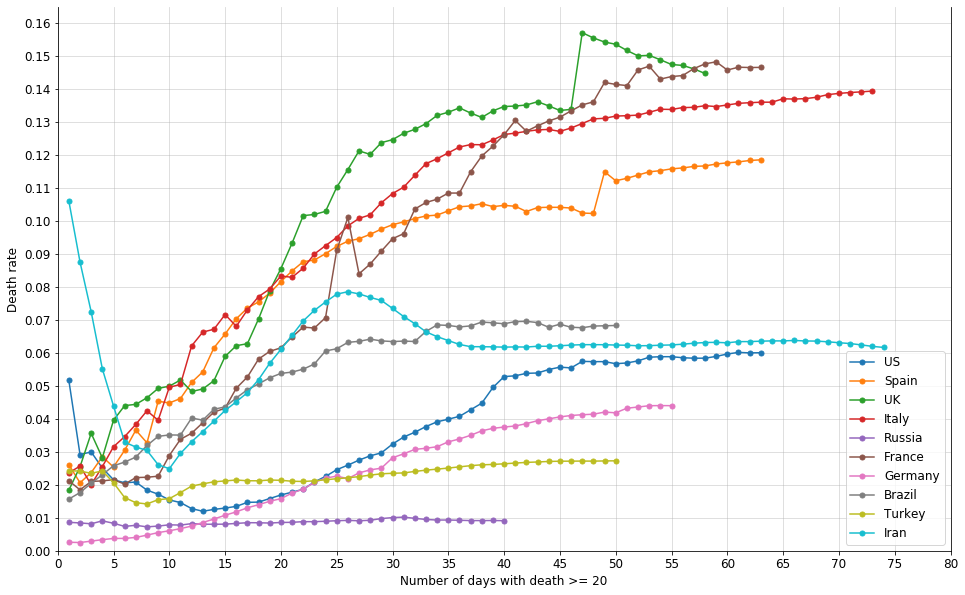
This plot describes the daily cumulative deaths rate for each country since the deaths arrived at 20 cases. Here we need to highlight some countries:
- France: highest deaths rate among 10 countries, continuous increasing from the beginning.
- Spain: its deaths rate follows the trend of Italy at the beginning, then it started to be stable from the 35th day after the 20th death.
- UK: continuous increasing from the beginning, on the 20th day after the 20th deaths, UK’s deaths rate is greater than Italy and Spain for the same number of day. Recently its death rate decreased to the second highest.
- Germany: continuous increasing slowing at the beginning, then it started to increase during the last month.
Reference
- Isaac Lin, “DXY-COVID-19-Data”, www.github.com. [Online]. Available: https://github.com/BlankerL/DXY-COVID-19-Data
- CSSEGISandData, “csse_covid_19data”, _www.github.com. [Online]. Available: https://github.com/CSSEGISandData/COVID-19/tree/master/csse_covid_19_data/csse_covid_19_daily_reports
- geralt, “virus coronavirus covid-19 pandemic”, pixabay.com. [Online]. Available: https://pixabay.com/illustrations/virus-coronavirus-covid-19-pandemic-5675422/