To get start with pandas, you need to get confortable with its two data
structures: series and dataframe. In this blog, we will talk about multiple
applications of dataframe.
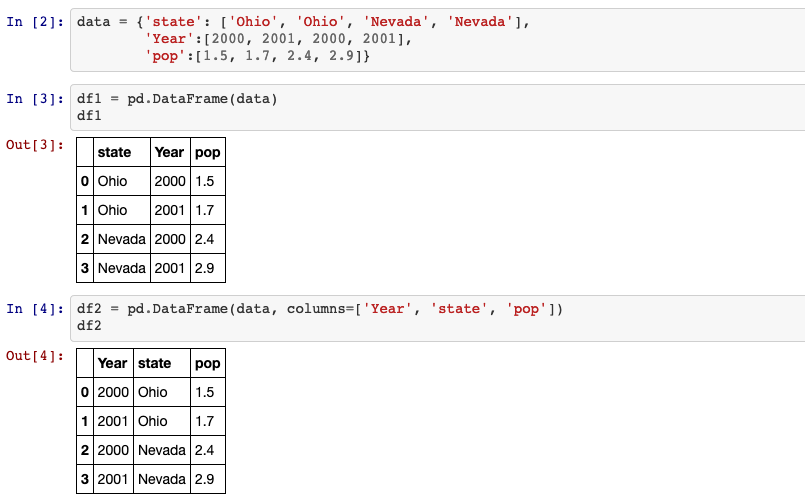
1. Creating a dataframe
Two-dimensional, size-mutable, potentially heterogeneous tabular data. Data structure also contains labeled axes (rows and columns). Arithmetic operations align on both row and column labels. Can be thought of as a dict-like container for Series objects. The primary pandas data structure.
pandas.DataFrame(data=None, index= None, columns= None, dtype= None, copy= False)
import pandas as pd

data = {'state': ['Ohio', 'Ohio', 'Nevada', 'Nevada'],
        'Year':[2000, 2001, 2000, 2001],
        'pop':[1.5, 1.7, 2.4, 2.9]}

df1 = pd.DataFrame(data)
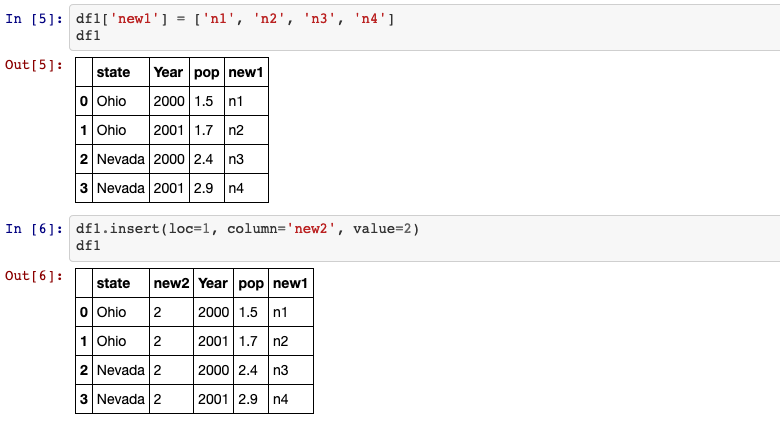
2. Creating a new column
DataFrame.insert(self, loc, column, value, allow_duplicates=False)
# method 1: Insert column into DataFrame as the last column.
df1['new1'] = ['n1', 'n2', 'n3', 'n4']
# method 2: Insert column into DataFrame at specified location.
df1.insert(loc=1, column='new2', value=2)
/!\ df[column] works for any column name, but df.column only works when the
column name is a valid Python variable name.
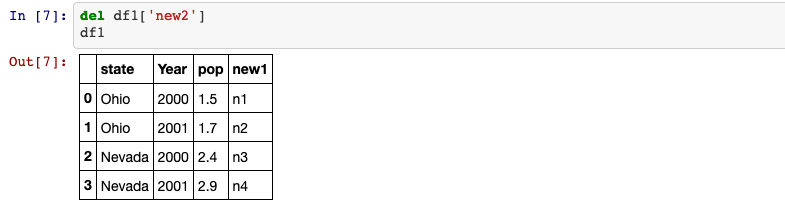
3. del
del method can be used to remove one column.
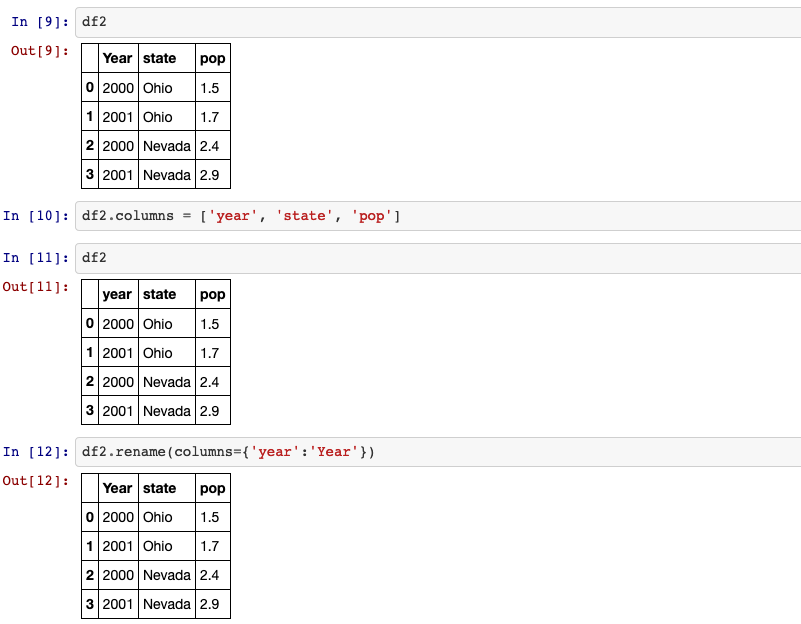
4. .columns
Return the column labels of the DataFrame.

5. Rename column
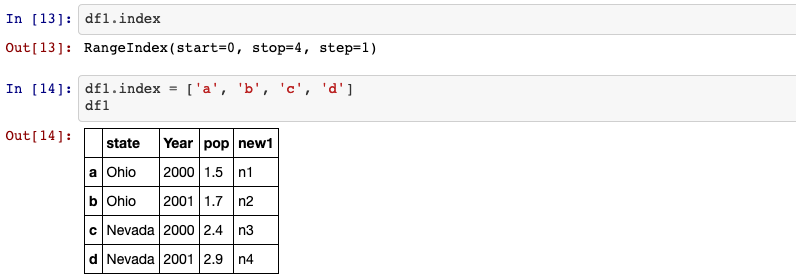
6. index
Return the index (row labels) of the DataFrame.
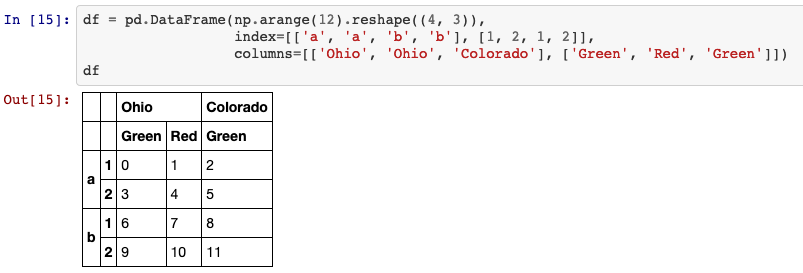
7. hierarchical indexing
Hierarchical indexing is an important feature of pandas that enables you to have multiple (two or more) index levels on an axis. It provides a way for working with higher dimensional data in a lower dimensional form.
df = pd.DataFrame(np.arange(12).reshape((4, 3)),
                  index=[['a', 'a', 'b', 'b'], [1, 2, 1, 2]],
                  columns=[['Ohio', 'Ohio', 'Colorado'], ['Green', 'Red', 'Green']])
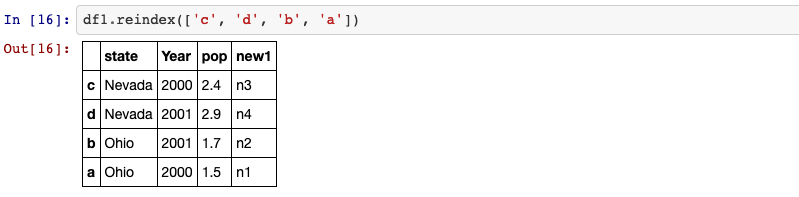
8. reindex
An important method on pandas objects is reindex, which means to create a new
object with the data consormed to a new index.
method: {None, ‘backfill’/’bfill’, ‘pad’/’ffill’, ‘nearest’}
Method to use for filling holes in reindexed DataFrame. Please note: this is
only applicable to DataFrames/Series with a monotonically increasing/decreasing
index.
None(default): don’t fill gapspad/ffill: Propagate last valid observation forward to next valid.backfill/bfill: Use next valid observation to fill gap.nearest: Use nearest valid observations to fill gap.
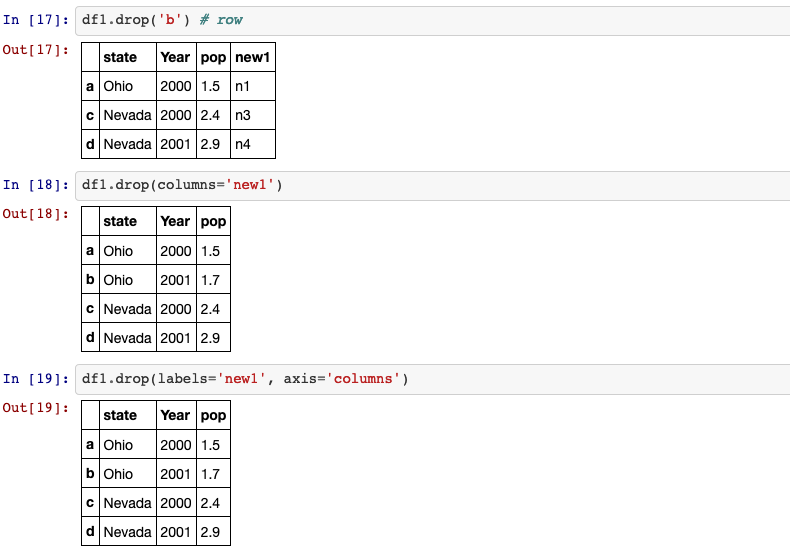
9. drop
drop method returns a new object with the indicated value or values deleted
from an axis.
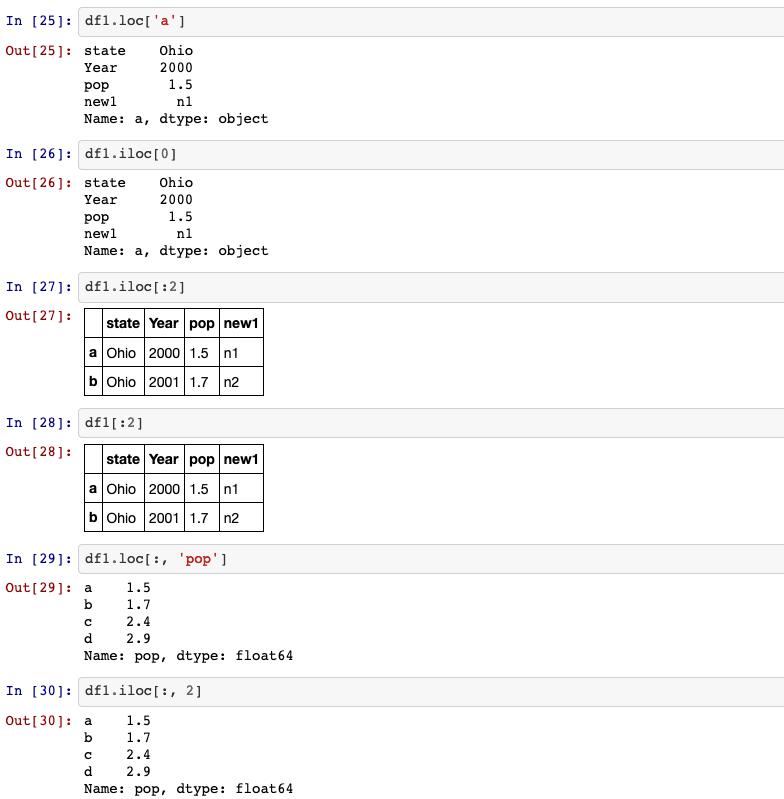
10. Selection, filtering
Dataframe indexing (df[...]) works analogously to NumPy array indexing, except
you can use the Dataframe’s index values instead of only integers.
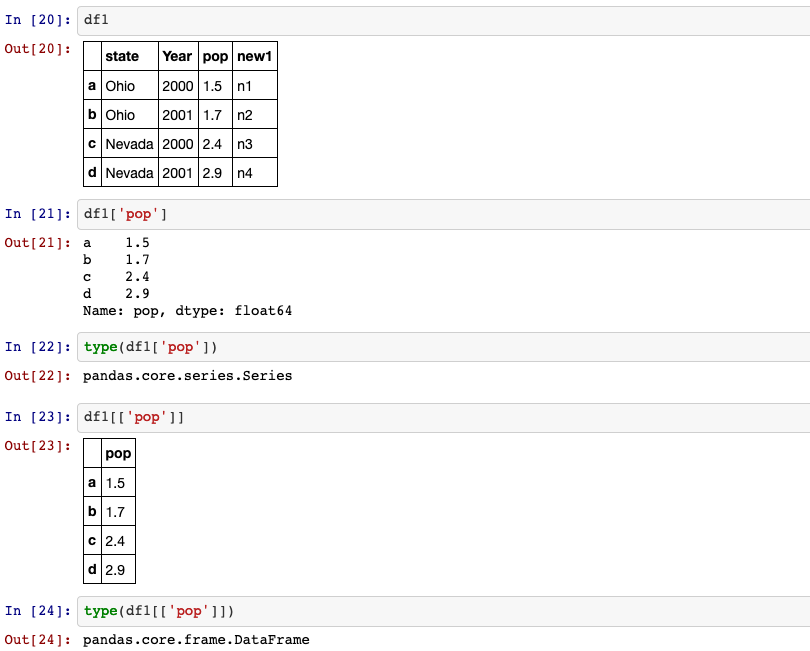
Moreover, you can also select a subset of the rows from a series with NumPy-like
notation using either axis labels (loc) or integers (iloc).
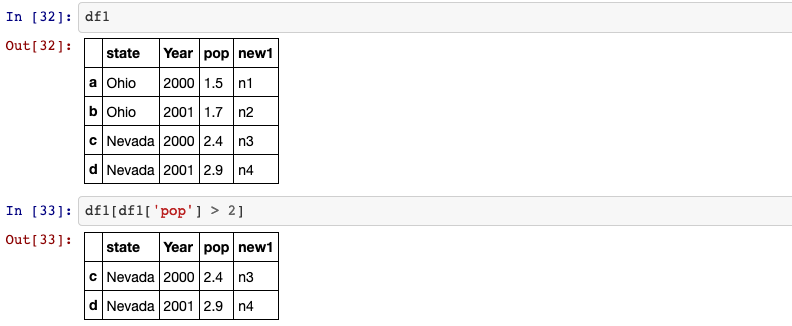
We can also apply df[condition] to get only the rows that satisfy the condition.
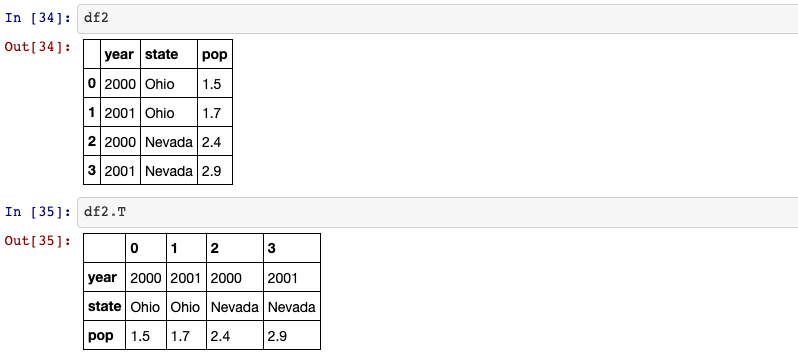
11. Transpose the dataframe
df.T
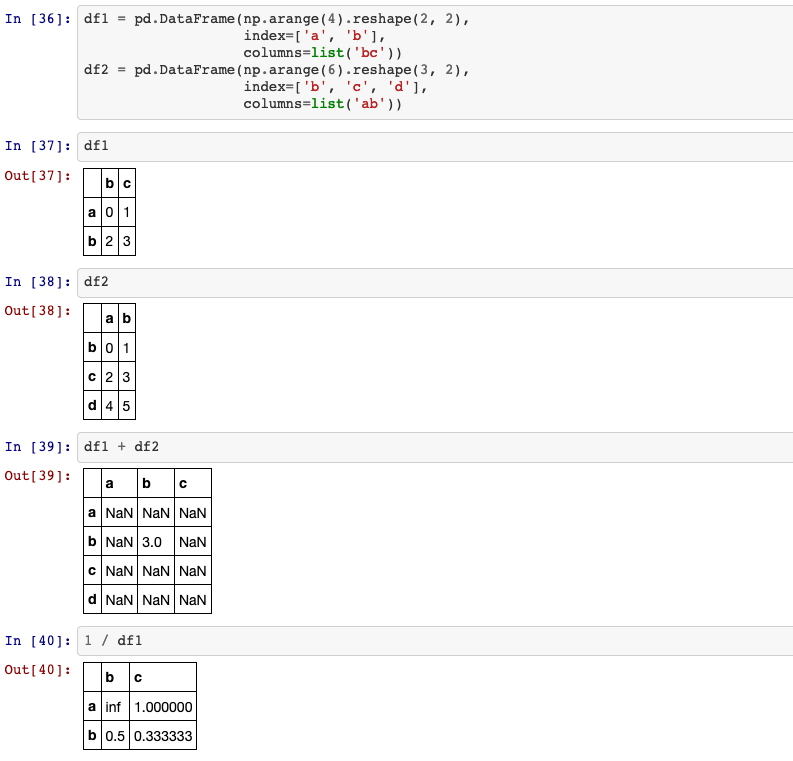
12. Arithmetic method
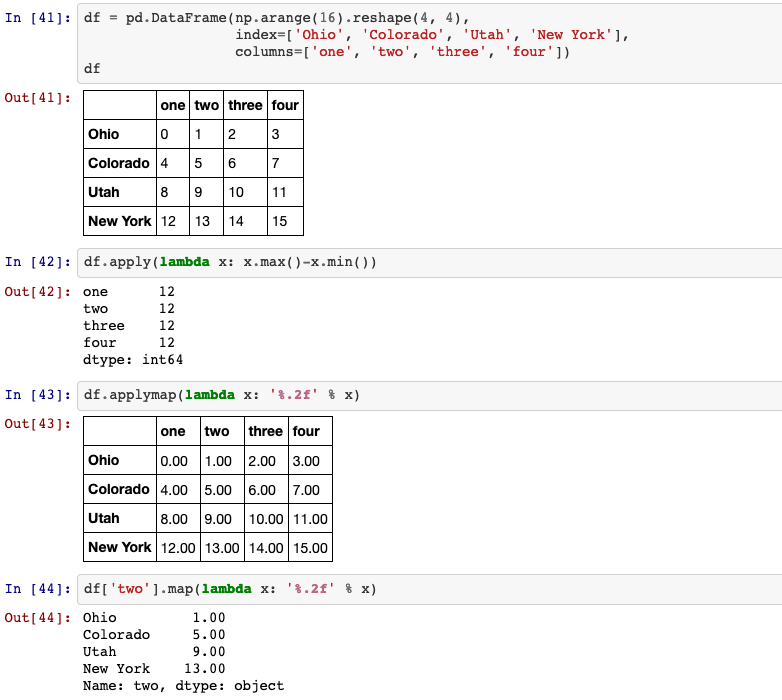
13. apply, applymap, map
apply: Invoke function on values of Series.
Can be ufunc (a NumPy function that applies to the entire Series) or a Python function that only works on single values.map: Map values of Series according to input correspondence.
Used for substituting each value in a Series with another value, that may be derived from a function, adictor a Series.
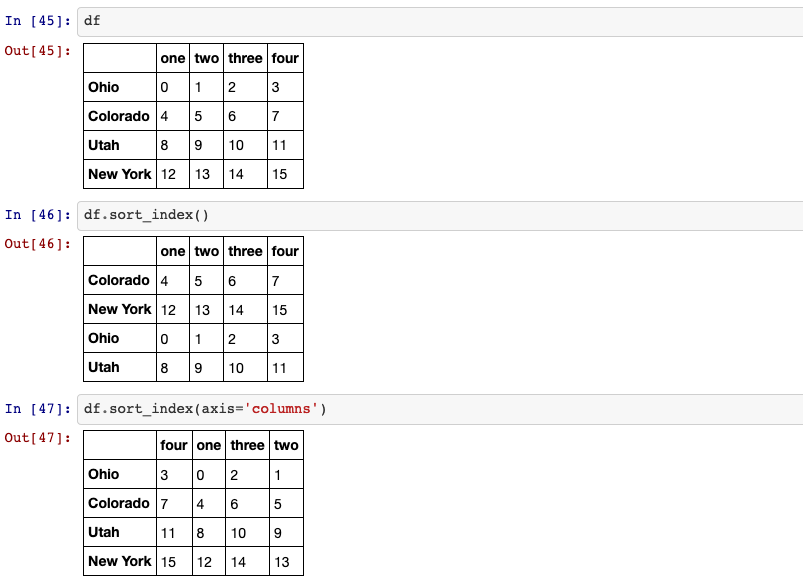
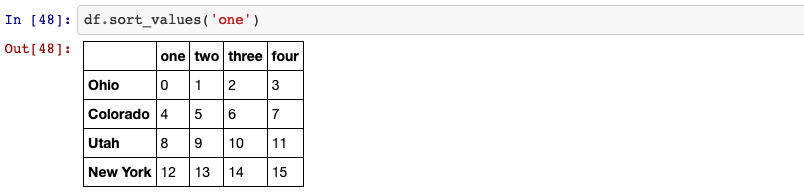
14. sorting
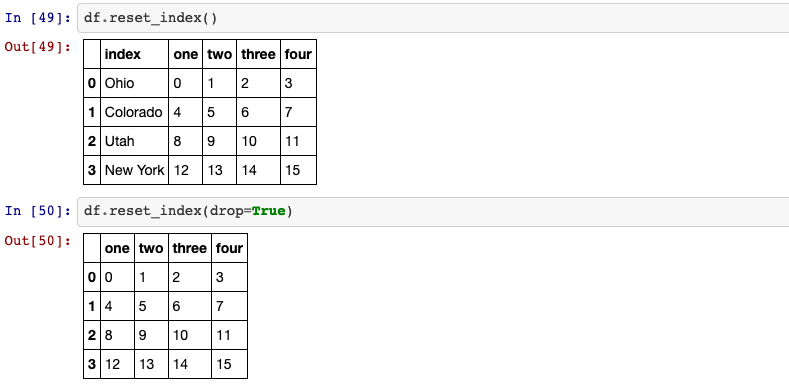
15. reset_index
Reset the index of the DataFrame, and use the default one instead. If the DataFrame has a MultiIndex, this method can remove one or more levels.
DataFrame.reset_index(self, level= None, drop=False, inplace=False, col_level=0, col_fill='')
drop: bool, default False. Do not try to insert index into dataframe columns.
This resets the index to the default integer index.
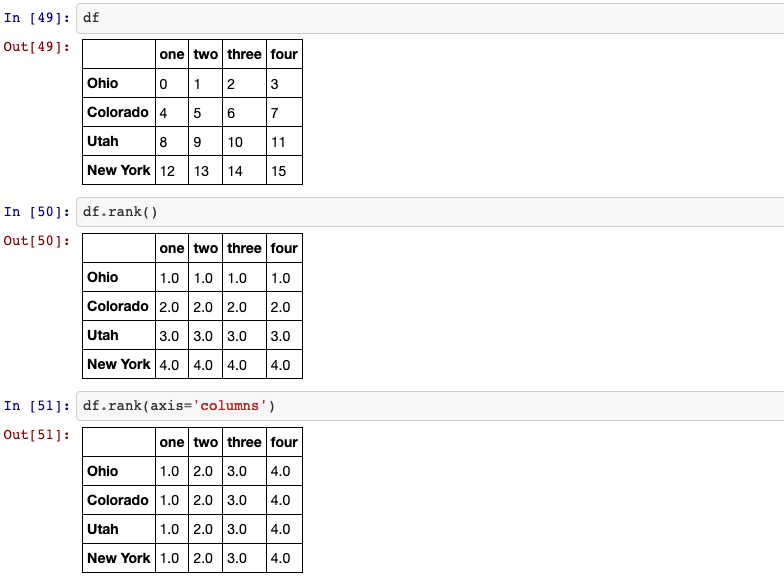
16. ranking
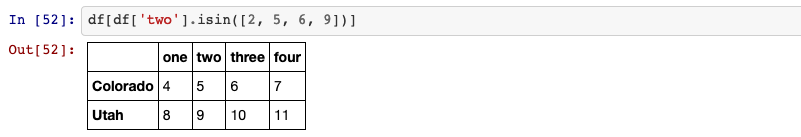
17. .isin()
Return whether each element in the DataFrame is contained in values.
18. is_unique
Return boolean if values in the object are unique.

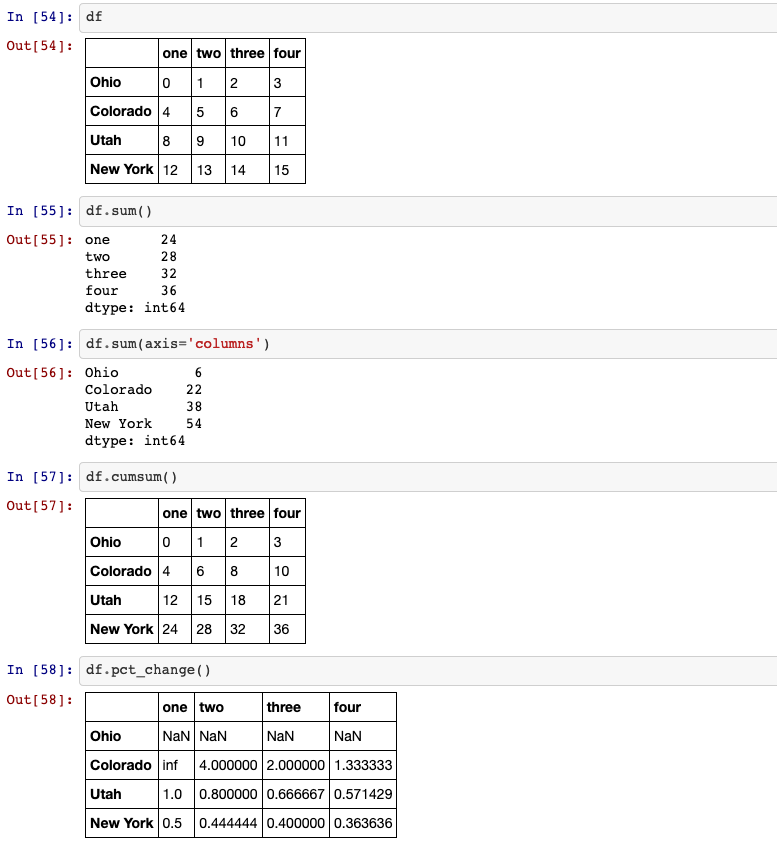
19. Computing descriptive statistics
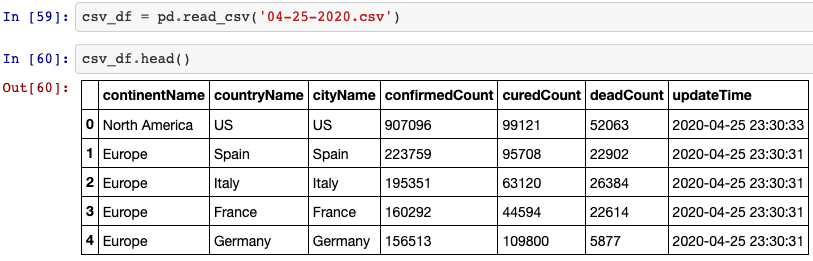
20. Importing a dataframe
Read a comma-separated values (csv) file into DataFrame:
pandas.read_csv()
Read general delimited file into DataFrame:
pandas.read_table()
Read an Excel file into a pandas DataFrame:
pandas.read_excel()
21. Exporting a dataframe
Write object to a comma-separated values (csv) file:
DataFrame.to_csv()
Write object to an Excel sheet:
DataFrame.to_excel()

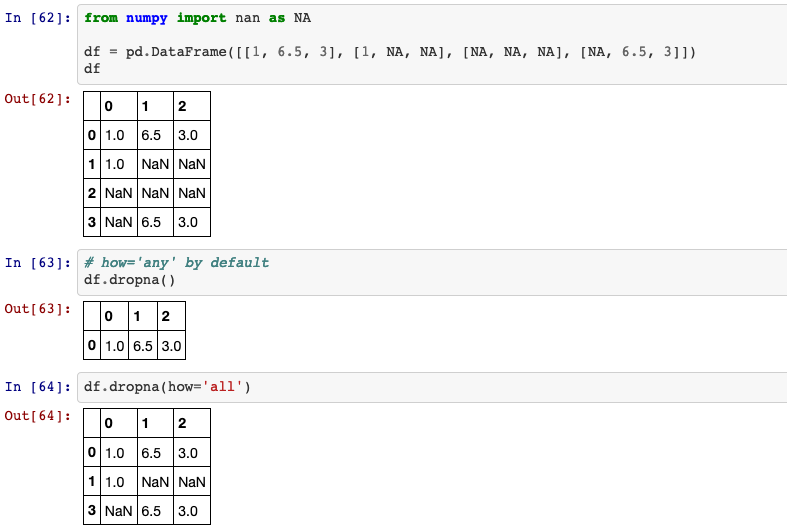
22. dropna & fillna
Remove missing values.
DataFrame.dropna(self, axis=0, how='any', thresh=None, subset=None, inplace=False)
how: {‘any’, ‘all’}, default ‘any’.
Determine if row or column is removed from DataFrame, when we have at least one NA or all NA.
any: If any NA values are present, drop that row or column.all: If all values are NA, drop that row or column.
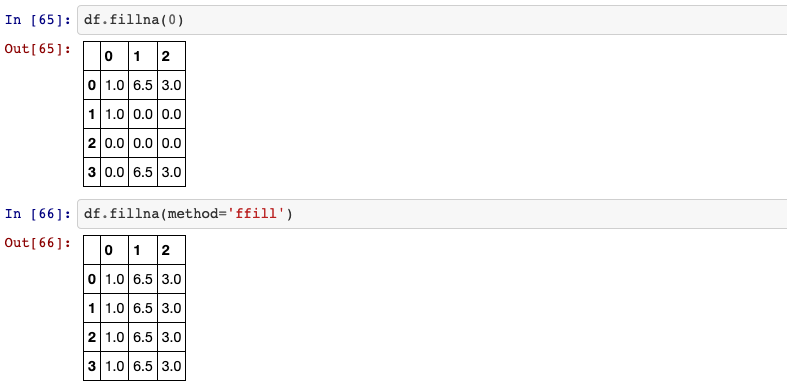
Fill NA/NaN values using the specified method.
DataFrame.fillna(self, value=None, method=None, axis=None, inplace=False, limit=None, downcast=None)
method: {‘backfill’, ‘bfill’, ‘pad’, ‘ffill’, None}, default None.
Method to use for filling holes in reindexed Series.
pad/ffill: propagate last valid observation forward to next validbackfill/bfill: use next valid observation to fill gap.
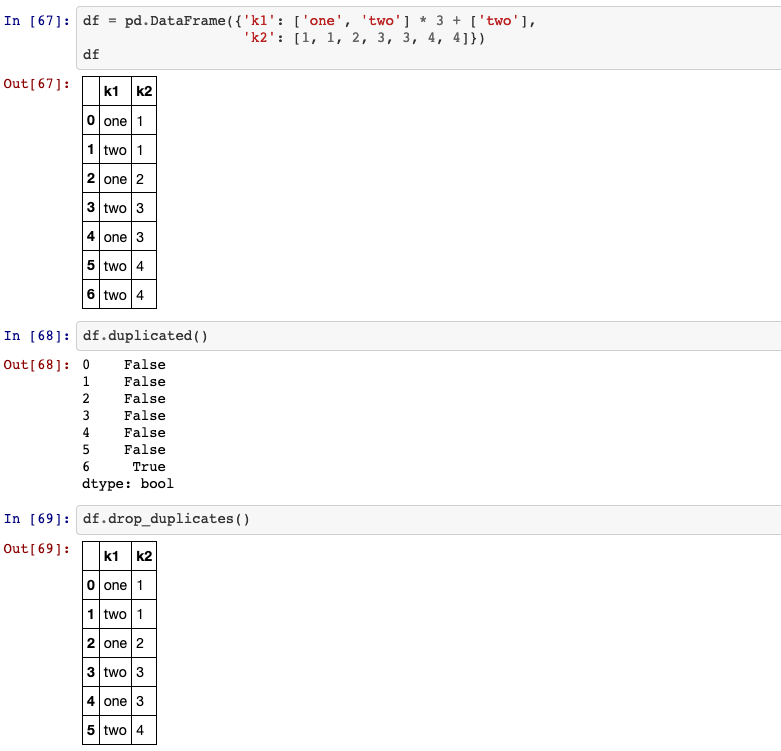
23. Removing duplicates
Return boolean Series denoting duplicate rows.
DataFrame.duplicated(self, subset=None, keep='first')
keep: {‘first’, ‘last’, False}, default ‘first’.
Determines which duplicates (if any) to mark.
first: Mark duplicates as True except for the first occurrence.last: Mark duplicates as True except for the last occurrence.False: Mark all duplicates as True.
DataFrame.drop_duplicates(self, subset=None, keep='first', inplace=False, ignore_index=False)
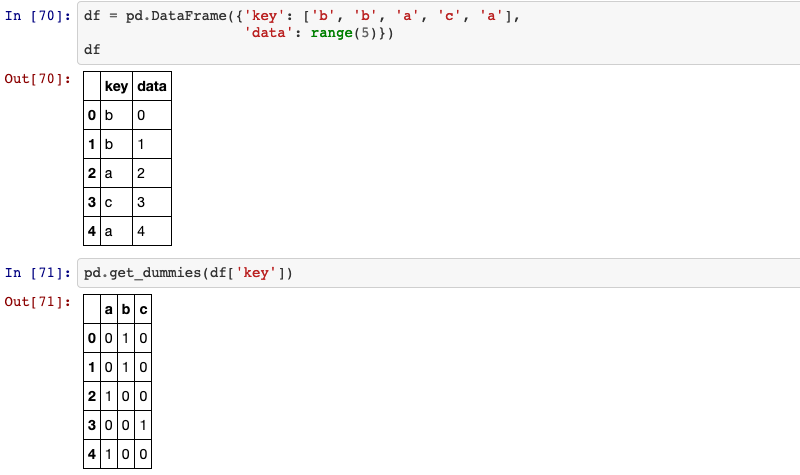
24. Dummy variables
Convert categorical variable into dummy/indicator variables.
pandas.get_dummies(data, prefix=None, prefix_sep='_', dummy_na=False, columns=None, sparse=False, drop_first=False, dtype=None)
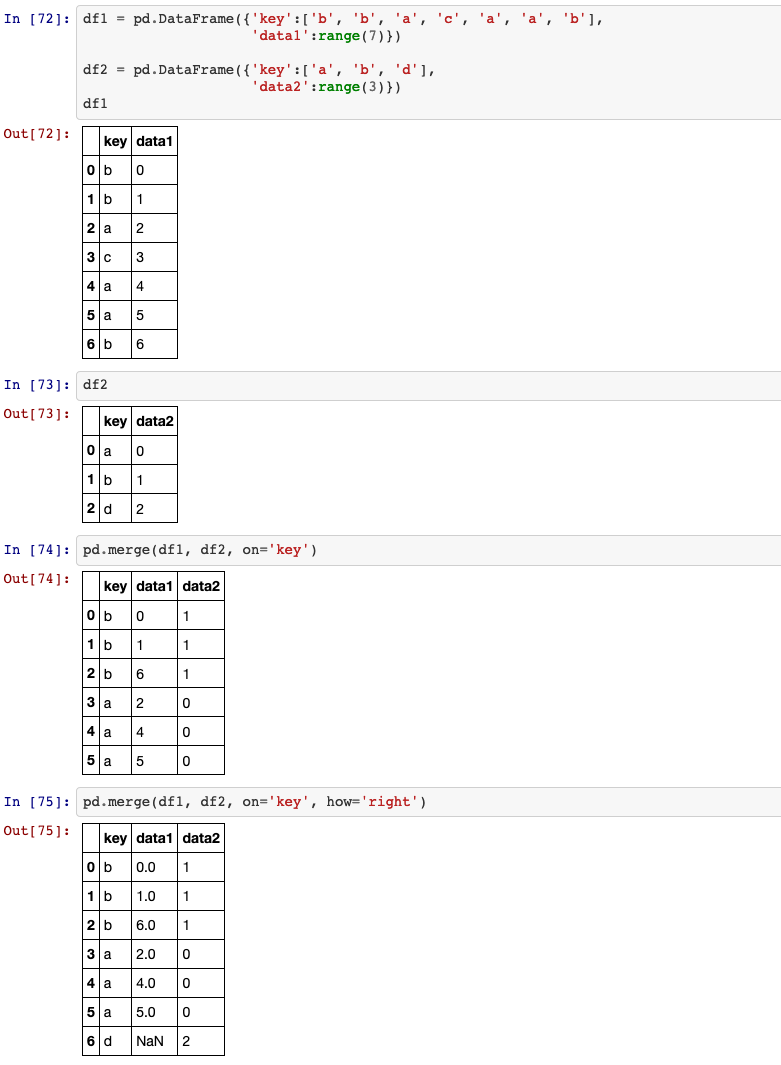
25. merge
Merge DataFrame or named Series objects with a database-style join.
The join is done on columns or indexes. If joining columns on columns, the
DataFrame indexes will be ignored. Otherwise if joining indexes on indexes or
indexes on a column or columns, the index will be passed on.
how:{‘left’, ‘right’, ‘outer’, ‘inner’}, default ‘inner’.
Type of merge to be performed.
left: use only keys from left frame, similar to a SQL left outer join; preserve key order.right: use only keys from right frame, similar to a SQL right outer join; preserve key order.outer: use union of keys from both frames, similar to a SQL full outer join; sort keys lexicographically.inner: use intersection of keys from both frames, similar to a SQL inner join; preserve the order of the left keys.
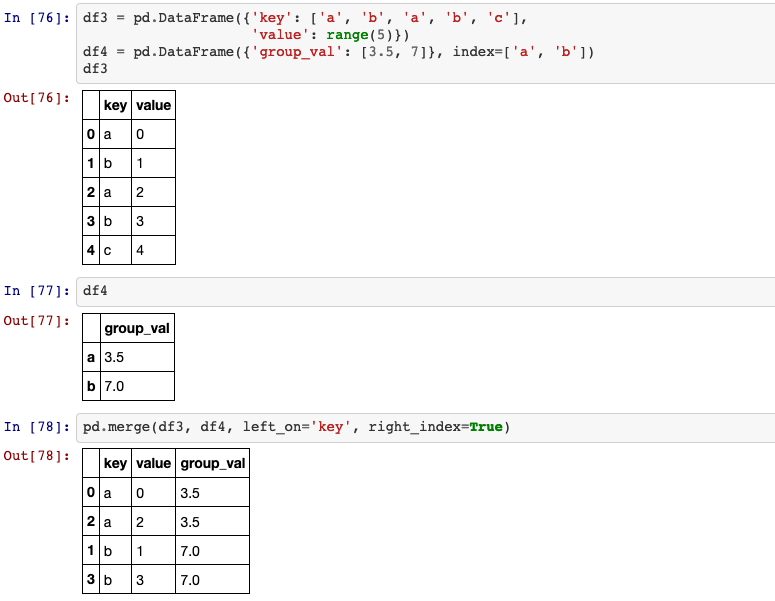
left_on: label or list, or array-like. Column or index level names to join on
in the left DataFrame. Can also be an array or list of arrays of the length of
the left DataFrame. These arrays are treated as if they are columns.
right_index: bool, default False. Use the index from the right DataFrame as
the join key. Same caveats as left_index.
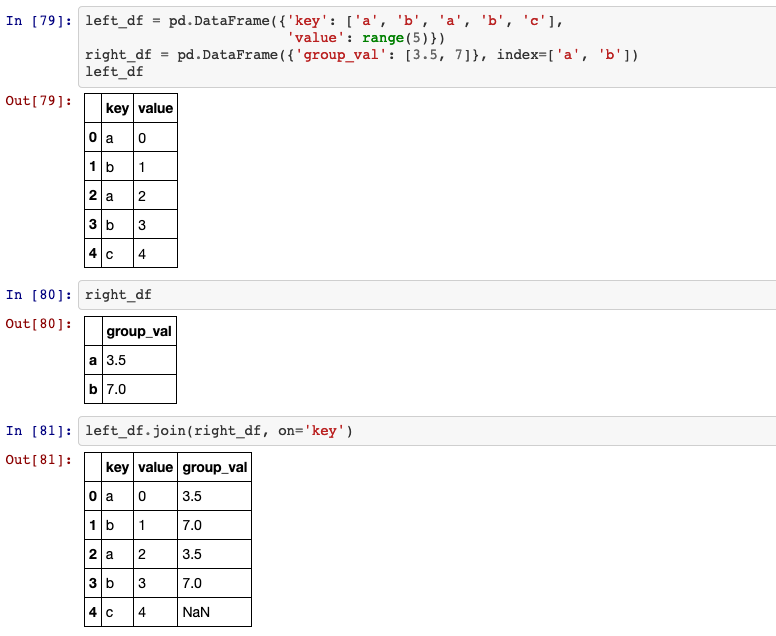
26. join
Join columns with other DataFrame either on index or on a key column. Efficiently join multiple DataFrame objects by index at once by passing a list.
DataFrame.join(self, other, on=None, how='left', lsuffix='', rsuffix='', sort=False)
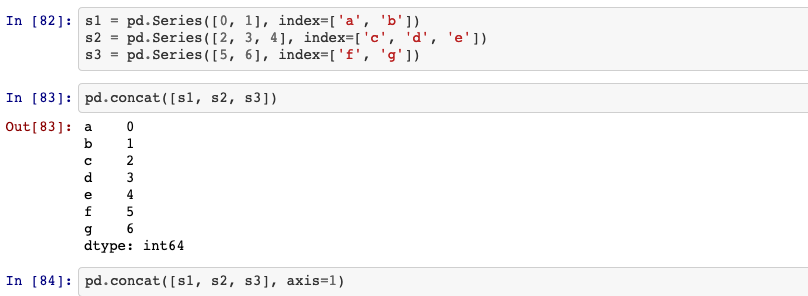
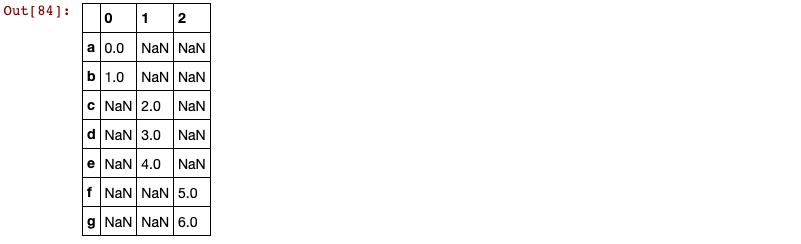
27. concat
The concat function in pandas provides a consistent way to address each of
these concerns.
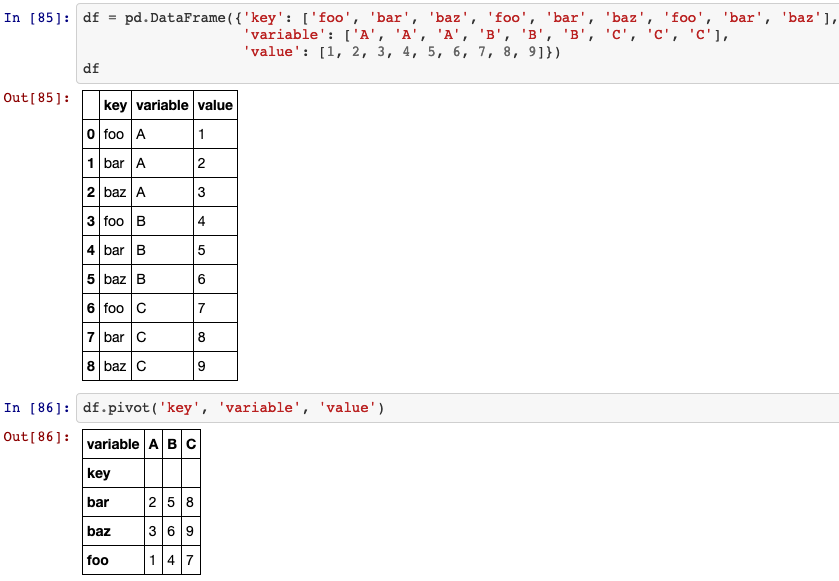
28. pivot
Reshape data (produce a “pivot” table) based on column values. Uses unique values from specified index / columns to form axes of the resulting DataFrame. This function does not support data aggregation, multiple values will result in a MultiIndex in the columns.
DataFrame.pivot(self, index=None, columns=None, values=None)
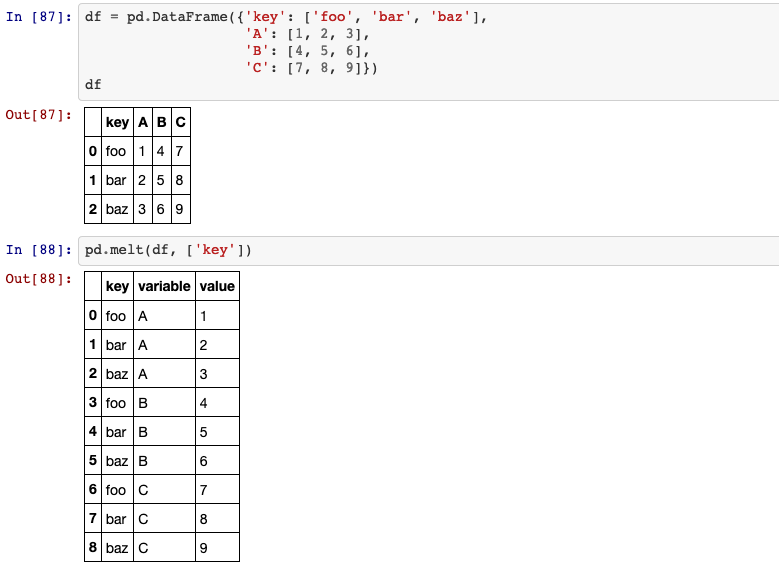
29. melt
Unpivot a DataFrame from wide to long format, optionally leaving identifiers set.
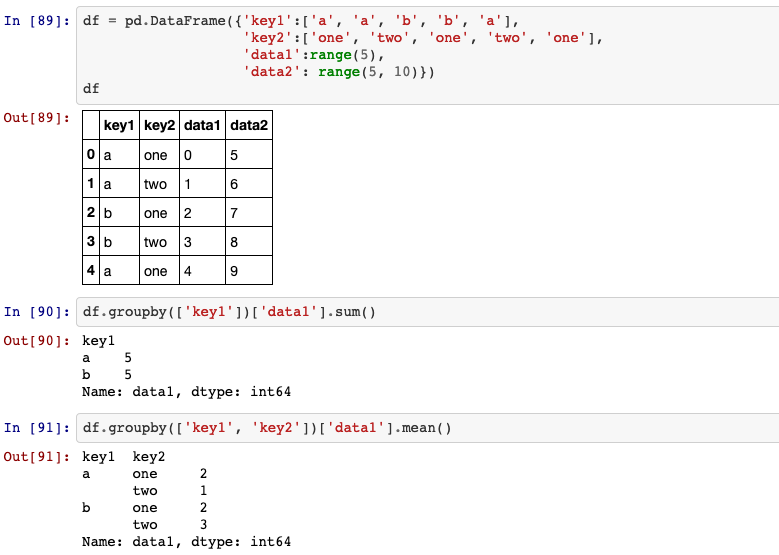
30. groupby
A groupby operation involves some combination of splitting the object,
applying a function, and combining the results. This can be used to group large
amounts of data and compute operations on these groups.
- by list of labels:
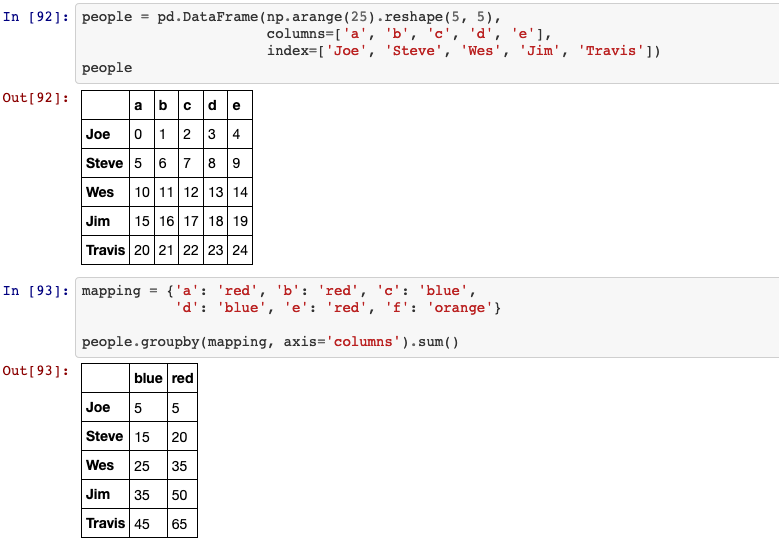
- by mapping:
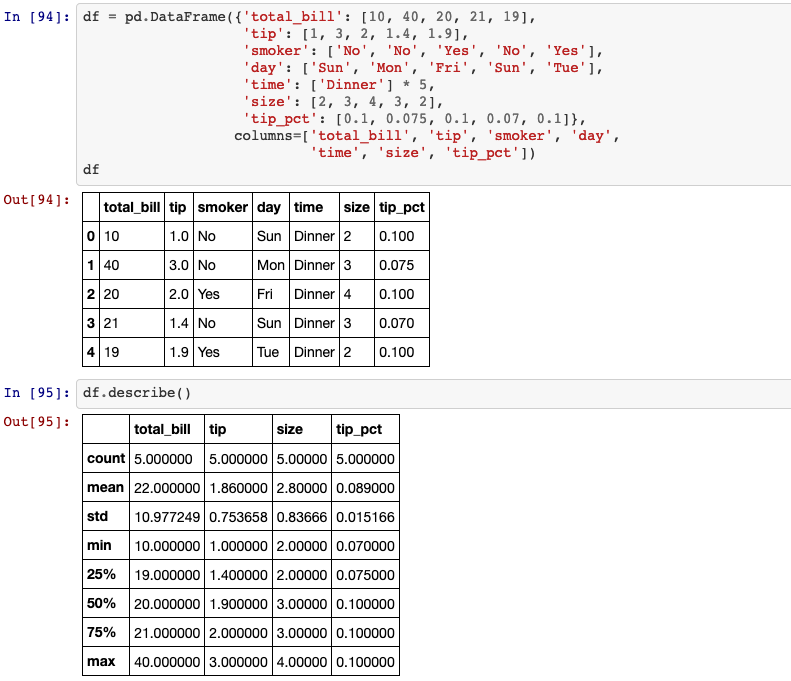
31. aggregation
Generate descriptive statistics. Descriptive statistics include those that summarize the central tendency, dispersion and shape of a dataset’s distribution, excluding NaN values. Analyzes both numeric and object series, as well as DataFrame column sets of mixed data types. The output will vary depending on what is provided.
DataFrame.describe(self, percentiles=None, include=None, exclude=None)
Aggregate using one or more operations over the specified axis.
DataFrame.agg(self, func, axis=0, *args, **kwargs)
func: function, str, list or dict. Function to use for aggregating the data.
If a function, must either work when passed a DataFrame or when passed to
DataFrame.apply. Accepted combinations are:
- function
- string function name
- list of functions and/or function names, e.g. [np.sum, ‘mean’]
-
dict of axis labels -> functions, function names or list of such.
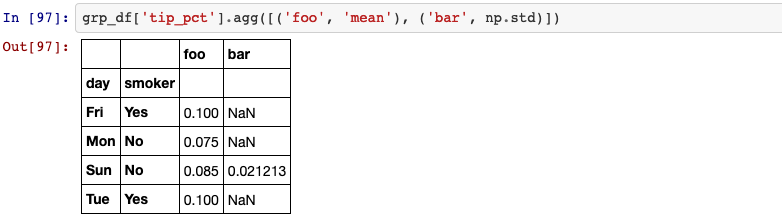
- list of functions:
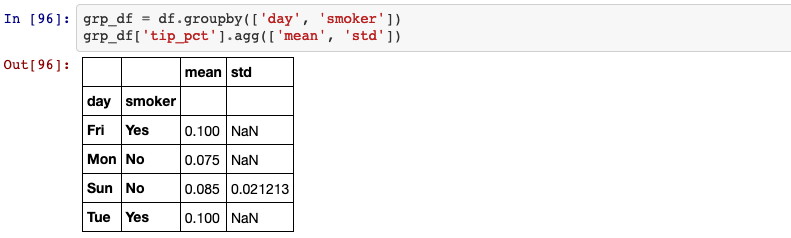
- if we pass a list of (
name,function) tuples, the first element of each tuple will be used as the dataframe column names:
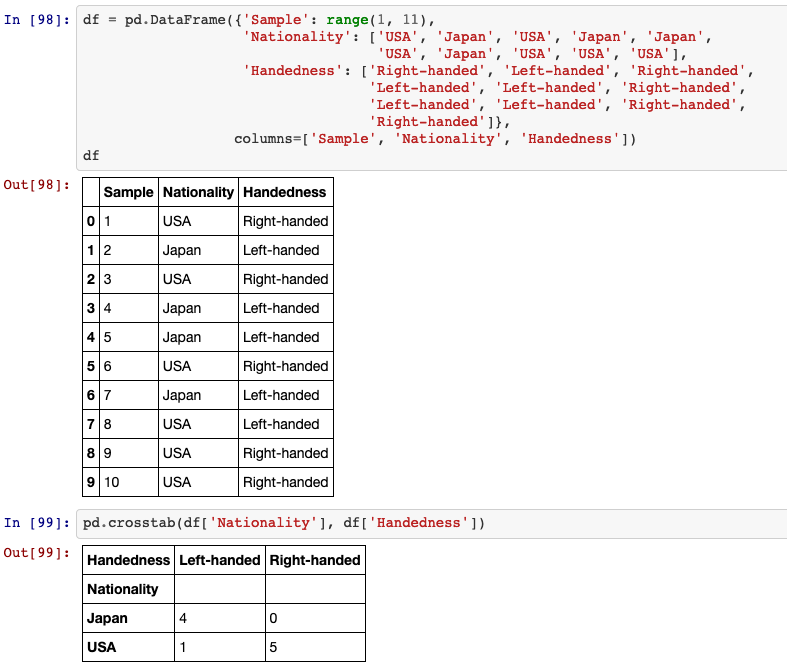
32. crosstab
Compute a simple cross tabulation of two (or more) factors. By default computes a frequency table of the factors unless an array of values and an aggregation function are passed.
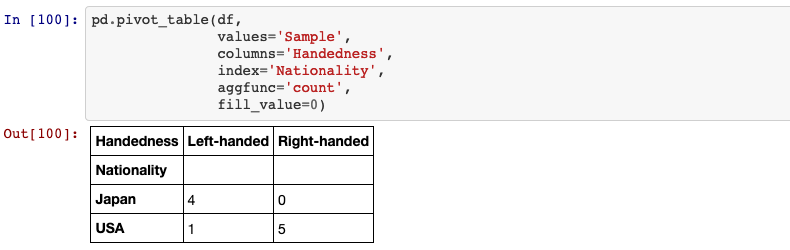
33. pivot_table
Create a spreadsheet-style pivot table as a DataFrame. The levels in the pivot table will be stored in MultiIndex objects (hierarchical indexes) on the index and columns of the result DataFrame.
Reference
- Wes McKinney. 2017. Python for Data Analysis DATA WRANGLING WITH PANDAS, NUMPY, AND IPYTHON
- sipa, “snake python ball python”, pixabay.com. [Online]. Available: https://pixabay.com/photos/snake-python-ball-python-419043/