Considering I will use Spark in my future work, I learnt how to manipulate data
with pyspark in a Docker container and am willing to share it with you! In my
blog, I’ll talk about the following points:
- Why Spark?
- Why Docker?
- Run the Docker container
- Simple data manipulation with pyspark
Why Spark?
Spark is a platform for cluster computing. Spark lets you spread data and computations over clusters with multiple nodes (think of each node as a separate computer). Splitting up your data makes it easier to work with very large datasets because each node only works with a small amount of data.
As each node works on its own subset of the total data, it also carries out a part of the total calculations required, so that both data processing and computation are performed in parallel over the nodes in the cluster. It is a fact that parallel computation can make certain types of programming tasks much faster.
Why Docker?
Developing apps today requires so much more than writing code. Multiple languages, frameworks, architectures, and discontinuous interfaces between tools for each lifecycle stage creates enormous complexity. Docker simplifies and accelerates your workflow, while giving developers the freedom to innovate with their choice of tools, application stacks, and deployment environments for each project.
Run the Docker container
Here, we will take advantage of the jupyter/pyspark-notebook Docker image, since it contains:
- Apache Spark
- Miniconda with Python 2.7.x and 3.x environments
- Jupyter Notebook
- Pre-installed versions of
pyspark, pandas, matplotlib, scipy, seaborn, and scikit-learn
docker run -it -p 8888:8888 -v $PWD:/home/jovyan/work jupyter/pyspark-notebook-it: run an image interactively-p: publish a container’s port(s) to the host-v: map current directory ($PWD) to the container’s/home/workdirectory
For more information about Docker commands, you can find them here.
Simple data manipulation with pyspark
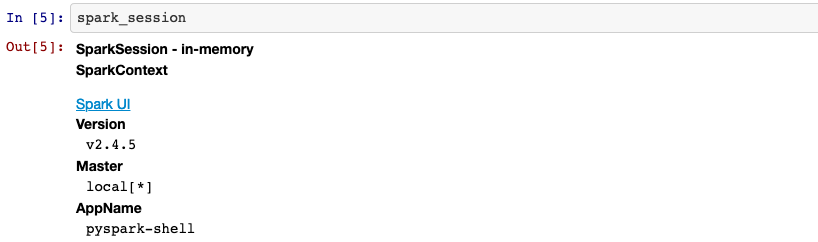
SparkContext & SparkSession
import pyspark
from pyspark.sql import SparkSession

sc = pyspark.SparkContext('local[*]')
spark_session = SparkSession.builder.getOrCreate()
In order to connect to a Spark cluster from PySpark, we need to create an
instance of the SparkContext class with pyspark.SparkContext. To start
working with Spark DataFrames, you first have to create a SparkSession object
from your SparkContext. You can think of the SparkContext as your connection
to the cluster and the SparkSession as your interface with that connection.
Viewing tables
Your SparkSession has an attribute called catalog which lists all the data
inside the cluster. This attribute has a few methods for extracting different
pieces of information.
One of the most useful is the .listTables() method, which returns the names
of all the tables in your cluster as a list.
spark_session.catalog.listTables()

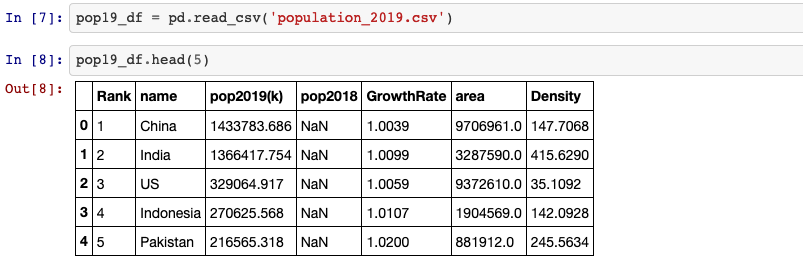
We have no table in our cluster. So I will import a csv file with pandas, then
put it into the Spark cluster.
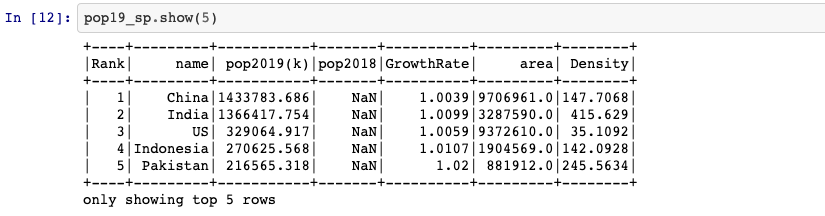
Put a pandas DataFrame into a Spark cluster
spark_temp = spark_session.createDataFrame(pop19_df)
spark_temp.createOrReplaceTempView('pop19')
The .createDataFrame() method takes a pandas DataFrame and returns a Spark
DataFrame. The output of this method is stored locally, NOT in the
SparkSession catalog. So we can use .createOrReplaceTempView() to create a
new temporary table if nothing was there before, or updates an existing table
if one was already defined.

SQL query
pop19_sp = spark_session.sql('SELECT * FROM pop19')
Calculate 2018 population for each country
pop19_sp = pop19_sp.withColumn('pop2018',
                               pop19_sp['pop2019(k)'] / pop19_sp['GrowthRate'])
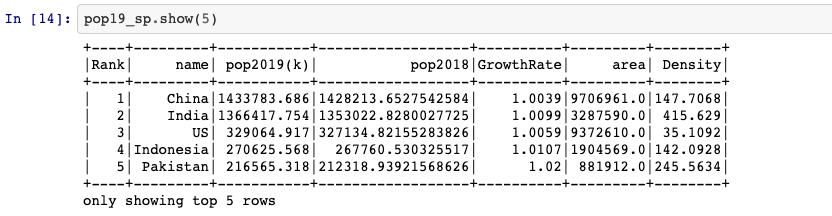
withColumn(colName, col) returns a new DataFrame by adding a column or
replacing the existing column that has the same name. Here I divide “pop2019(k)”
by “GrowthRate” for calculating 2018’s population.
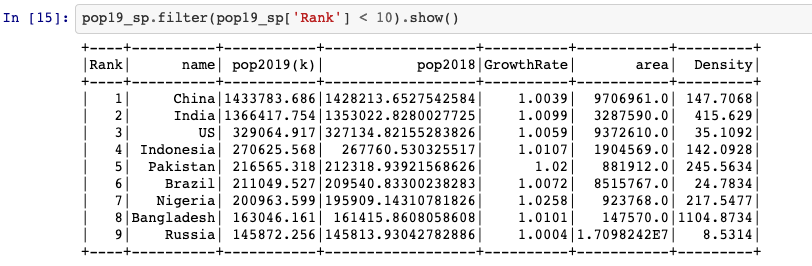
Top 10 countries
pop19_sp.filter(pop19_sp['Rank'] < 10).show()
Reference
- “Getting to know pyspark”, campus.datacamp.com. [Online]. Available: https://campus.datacamp.com/courses/introduction-to-pyspark/getting-to-know-pyspark?ex=1
- “Why Dicjer”, www.docker.com. [Online]. Available: https://www.docker.com/why-docker
- Max Melnick, “Quick-start Apache Spark Environment Using Docker Containers”, maxmelnick.com. [Online]. Available: http://maxmelnick.com/2016/06/04/spark-docker.html
- “0*Vs8O_whiQvaqSyD4”, miro.medium.com. [Online]. Available: https://miro.medium.com/max/2000/0*Vs8O_whiQvaqSyD4.png