For the end of master, I’m doing my internship at French Development Agency as a data analyst in Guarantee Division (GAR), which offers guarantees to banks providing loans to SMEs, thus limiting their risks.
In order to record the business operation of GAR, we have several databases. Thus, during this internship, my principal mission is according to the business procedure of GAR, merge all datasources into one with the process ETL (Extraction -Transfer-Load), then analyse data to get the valuable information, which contributes to our business.
Since I will finish it in two weeks, here I will share you its most important and interesting part – data analysis with machine learning algorithm. In consideration of the business of our division, the most important thing is not only establishing business relation with more and more banks, but also limiting the amount of compensation. Thus, I analysed the influence of different elements on total amount of compensation in R, with Linear Regression Model and Decision Tree.
Linear Regression Model
Model
As I mentioned above, the aim of analysis is to state the relationship between each different elements and total amount of compensation. So the model is as following.
The dependant variable represents the total amount of compensation in euro. The explanatory variable includes several control variables such as the loan amount in euro, the guarantee amount in euro, and dummy variables of countries, guarantee types, primary beneficiaries (our clients, i.e. banks), final beneficiaries (banks’ clients, i.e. loanees). Among the omitted factors represented by the error term, income of final beneficiaries may directly affect the loan amount.
Data
Since we focused on the total amount of compensation, the dataset “guarantee activation” has been used for analysing. In this dataset, we have 296 observations of 79 variables, I used 11 most important variables of them: total amount of compensation in euro, N° concours, guarantee type, country, primary beneficiary, N° primary beneficiary, final beneficiary, N° final beneficiary, loan amount in euro, guarantee amount in euro and exchange rate.
Moreover, 36 observations are excluded due to incomplete information and 94 observations are excluded because of zero compensation amount. Thus, the final sample consists of 166 observations instead of 296 observations with missing value. Besides, since the amount of compensation, the loan amount and the guarantee amount are pretty large, I reduced them by one thousand, which wouldn’t influence the result of analysis.
Data visualisation
Before analysing, let’s make some graphs to better understand our data.
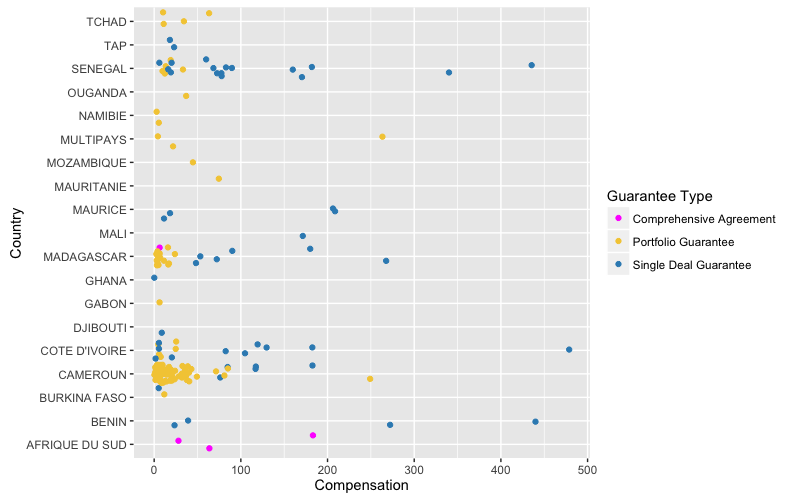
In this graph, x-axis stands for the amount of compensation (in thousand euro), y-axis shows the name of country, legend indicates three guarantee types. So we can clearly find that banks in Cameroon demand more compensation than others which is mainly in the case of Portfolio Guarantee with the amount lower the 100 k€. Besides, for Single Deal Guarantee, the compensation amount is more various, but most of them are lower than 300 k€. Moreover, the compensation of Comprehensive Agreement is the least one, that might because this type of guarantee is no longer commercialised.
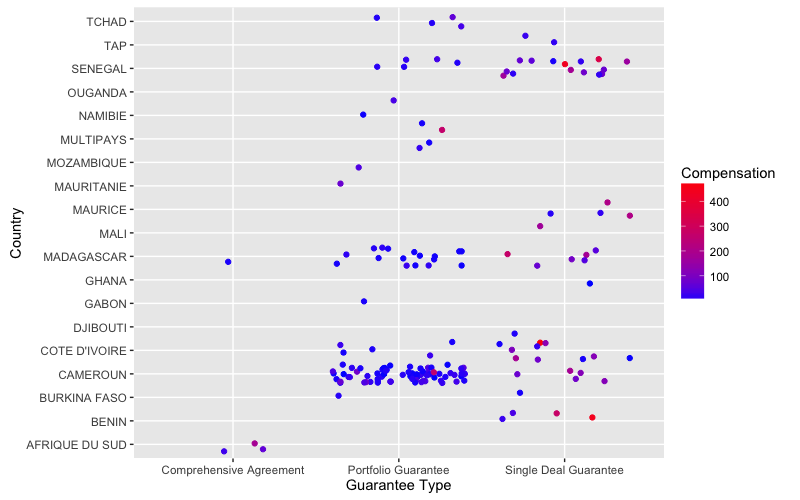
According to this graph, we can get similar idea as the previous one.
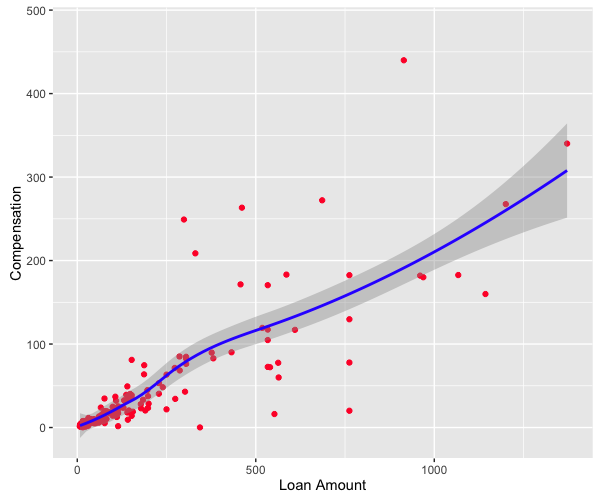
This graph shows that with the increasing of loan amount, the compensation increases, which is the same as we expect.
Result
I show the most important coefficients as following:
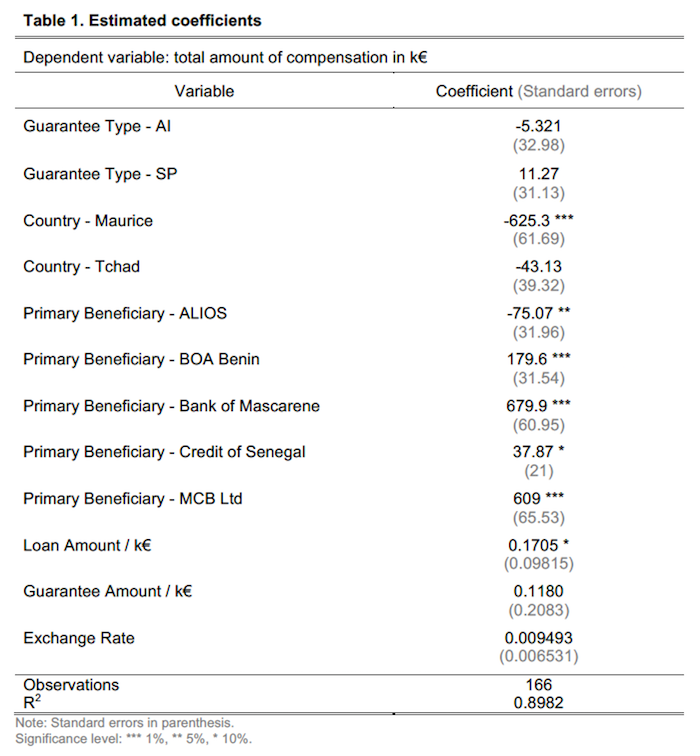
As Table 1 shows, according to the p-values which are under the significant level, I got the variables that have significant effects on the total amount of compensation. The country Maurice, the primary beneficiary BOA Benin, Bank of Mascarene and MCB Ltd have significant effects on total amount of compensation at 1%. At 5% level, the primary beneficiary ALIOS has a significant impact on total amount of compensation and at 10% level, the beneficiary Credit of Senegal and the loan amount also have a significant impact on it.
Some of the variables above have positive effects on the amount of compensation. Ceteris paribus, signing one contract with BOA Benin increases 179.6 thousand euros of total compensation. Signing one contract with Bank of Mascarene leads to 679.9 thousand more euros, ceteris paribus. Thanks to the estimation analysis, one contract with MCB Ltd increases total compensation by 609 thousand euros. Besides, there are other two variables whose effects are not that outstanding. Ceteris paribus, one contract with Credit of Senegal results in 37.87 thousand euros’ compensation. In addition, a €1000-increasing in the loan amount augments compensation amount by 17.05%.
Moreover, we can observe that the model fits well the data since the value of R2 is 89.82%, which is pretty high. However, the p-value and R2 are not enough. In order to check whether this linear model is really confidential, I firstly checked if the observations are independent with following codes and got the graph below:
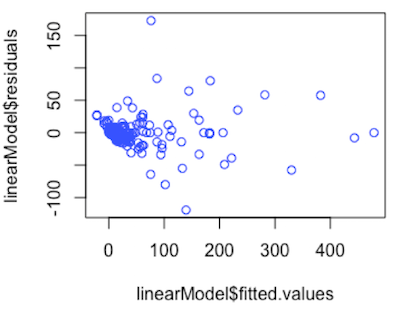
plot(lm_mej$fitted.values, lm_mej$residualsAccording to this graph, we can observe that there is no correlation between fitted values and residual, which means the observations are independent. Then, I checked if all errors are normally distributed with the same variance and mean equals to 0.
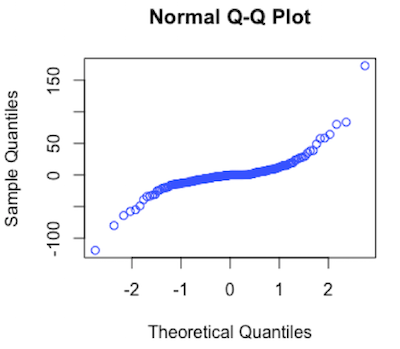
qqnorm(lm_mej$residuals)This graph compares the quantiles of the residuals to the quantiles of the normal distribution. It presents approximately a line, which indicated all errors are normally distributed.
The statistical analysis by R tells us which bank has higher probability of demanding the compensation, which means we should pay attention on it. For instance, as the result of analysis, Bank of Mascarene has a significant effect on total amount of compensation at 1%, so we may pay attention on this bank and consider the rationality of our agreement with it.
Decision Tree
In this part, the algorithm CART(Classification And Regression Tree) is used.
Firstly, the amount of compensation is divided into 3 groups(A, B and C),
according to the quantile. Then, all data are separated into training set and
test set, with the ratio 3/1. Next, in order to create a Decision Tree, we
need to use library(rpart) and library(rpart.plot). Now, let’s see some
details!
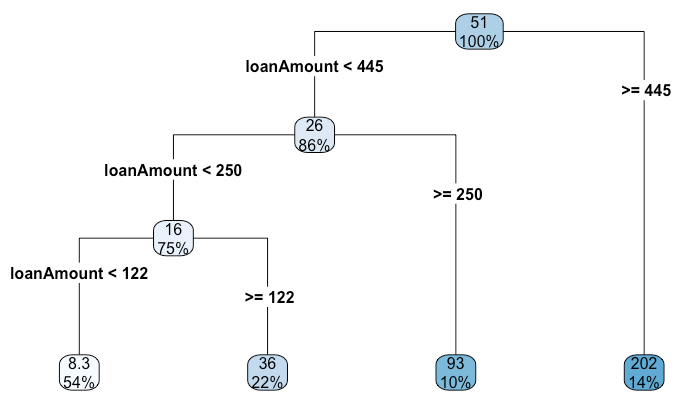
Regression Tree
The Regression Tree can be created by the function rpart() with method =
"anova", then use rpart.plot() to get the following graph.
Classification Tree
Similar as Regression Tree, Classification Tree is created by the function
rpart() but with method = "class", and use rpart.plot() to get its graph.
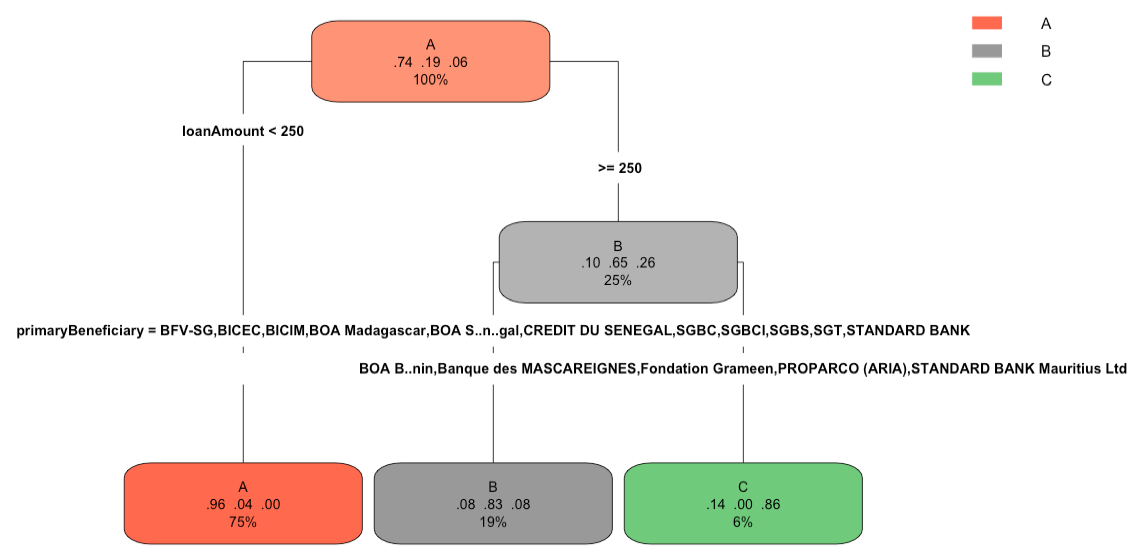
Moreover, we can check the prediction with test set and find the error rate is 7.9%. Besides, according to the following confusion matrix, we can get accuracy is 92%, which is pretty high.
   predClass
     A  B  C
  A 28  1  0
  B  0  7  0
  C  0  2  0
If you are interested in the R script, please check it on my Github, all propositions are welcome!
Reference
- freephotocc, “notebook laptop macbook conceptual”, pixabay.com. [Online]. Available: https://pixabay.com/photos/notebook-laptop-macbook-conceptual-1280538/