Content
- Project understanding
- Objectif
- Practice skills
- Python packages to be applied
- Data description
- Data cleaning
- Data analysis
- Train model
- Reference
Project understanding
The sinking of the RMS Titanic is one of the most infamous shipwrecks in history. On April 15, 1912, during her maiden voyage, the Titanic sank after colliding with an iceberg, killing 1502 out of 2224 passengers and crew. This sensational tragedy shocked the international community and led to better safety regulations for ships.
One of the reasons that the shipwreck led to such loss of life was that there were not enough lifeboats for the passengers and crew. Although there was some element of luck involved in surviving the sinking, some groups of people were more likely to survive than others, such as women, children, and the upper-class.
Objectif
In this challenge, we need to analyse what sorts of people were likely to survive. In particular, we also need to apply the tools of machine learning to predict which passengers survived the tragedy.
Practice skills
- Python 3
- Data visualisation
- Binary classification
Python packages to be applied
import pandas as pd
import numpy as np
import matplotlib.pyplot as plt
import seaborn as sns

from sklearn.base import BaseEstimator, TransformerMixin
from sklearn.pipeline import Pipeline, FeatureUnion
from sklearn.impute import SimpleImputer
from sklearn.preprocessing import OneHotEncoder, StandardScaler
from sklearn.model_selection import RandomizedSearchCV, GridSearchCV
from sklearn.metrics import mean_squared_error
from scipy.stats import reciprocal, uniform

from sklearn.tree import DecisionTreeClassifier
from sklearn.linear_model import LogisticRegression
from sklearn.svm import SVC, LinearSVC
from sklearn.ensemble import RandomForestClassifier
Data description
| Variable | Definition | Key |
|---|---|---|
| Survived | Survival | |
| Pclass | Ticket class | 1 = 1st, 2 = 2nd, 3 = 3rd |
| Name | Name | |
| Sex | Sex | |
| Age | Age in years | Age is fractional if less than 1. If the age is estimated, is it in the form of xx.5 |
| SibSp | # of siblings / spouses aboard the Titanic | Sibling = brother, sister, stepbrother, stepsister. Spouse = husband, wife (mistresses and fiancés were ignored) |
| Parch | # of parents / children aboard the Titanic | Parent = mother, father. Child = daughter, son, stepdaughter, stepson. Some children travelled only with a nanny, therefore parch=0 for them. |
| Ticket | Ticket number | |
| Fare | Passenger fare | |
| Cabin | Cabin number | |
| Embarked | Port of Embarkation | C = Cherbourg, Q = Queenstown, S = Southampton |
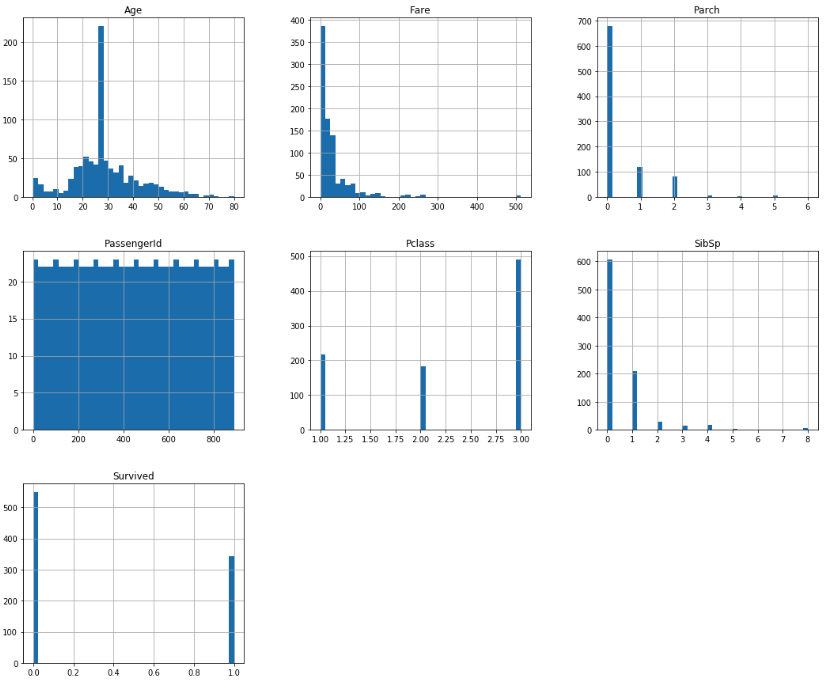
train_df.info()
# <class 'pandas.core.frame.DataFrame'>
# RangeIndex: 891 entries, 0 to 890
# Data columns (total 12 columns):
# PassengerId    891 non-null int64
# Survived       891 non-null int64
# Pclass         891 non-null int64
# Name           891 non-null object
# Sex            891 non-null object
# Age            714 non-null float64
# SibSp          891 non-null int64
# Parch          891 non-null int64
# Ticket         891 non-null object
# Fare           891 non-null float64
# Cabin          204 non-null object
# Embarked       889 non-null object
# dtypes: float64(2), int64(5), object(5)
=> There are missing data in “Age”, “Cabin” and “Embarked”, especially “Cabin” whose 77% data are missing. So we will ignore it during the analysis.
What should we do on missing data of “Age”? We might replace null by median age. Same for “Embarked”
=> On average, the probability of one passenger being survived is 38%.
Data cleaning
train_df['Embarked'].value_counts()
# S    644
# C    168
# Q     77
# Name: Embarked, dtype: int64

train_df['Age'].fillna(train_df['Age'].median(), inplace=True)
train_df['Embarked'].fillna('S', inplace=True)
Data analysis
Correlation matrix between numerical values and “Survived”
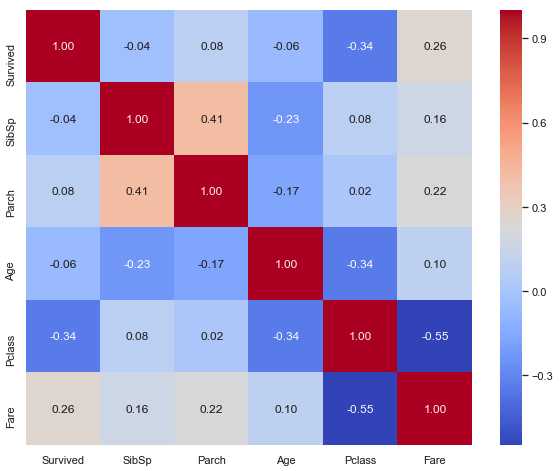
According to this correlation heatmap, we find that “Survived” possibility is slightly negative correlated with “Age”, which means that the older the passenger is, the more possible he will be survived; it’s significant at 5%. “Pclass” and “Fare are negatively correlated which is logic: the better class is, the more expensive fare is. “Pclass” is also negative correlated with “Survived” possibility, maybe the top class’s location is nearer to exit?
SibSp vs. Survived
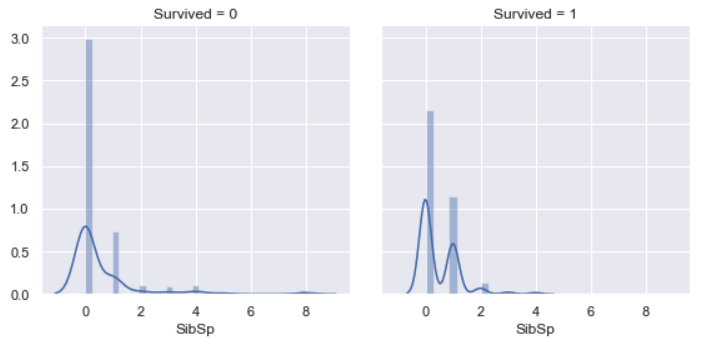
Most of survived people didn’t have siblings / spouses aboard the Titanic, other survived majority is people who had one sibling / spouse aboard the Titanic. Very few people who had more than one sibling / spouse aboard the Titanic were survived, since it’s difficult to survive all passengers.
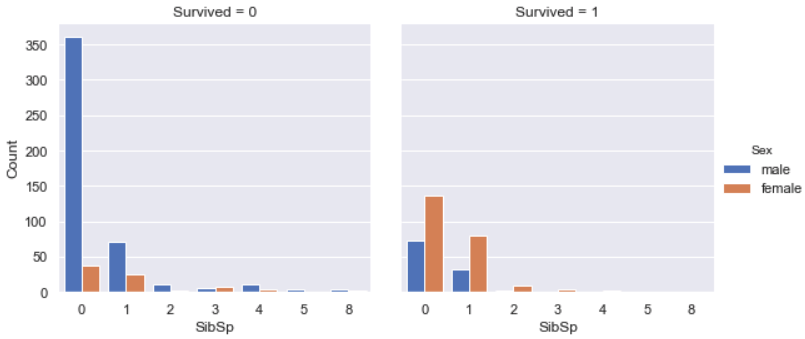
Among all survivals, the majority was female.
Parch vs. Survived
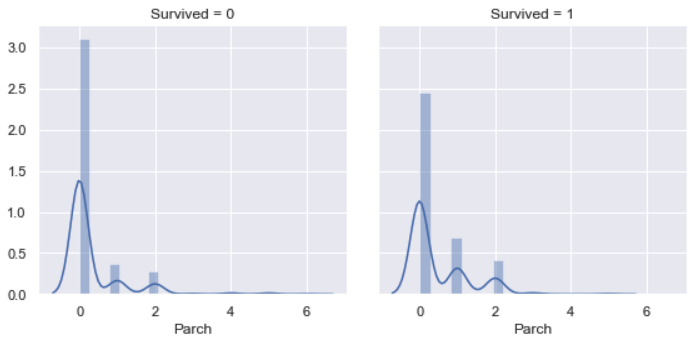
Similarly as relation between SibSp vs. Survived, most of survived people did not have parents / children aboard the Titanic, other survived majority is people who had one parent / child aboard the Titanic. Very few people who had more than one parent / child aboard the Titanic were survived, since it’s difficult to survive all passengers.
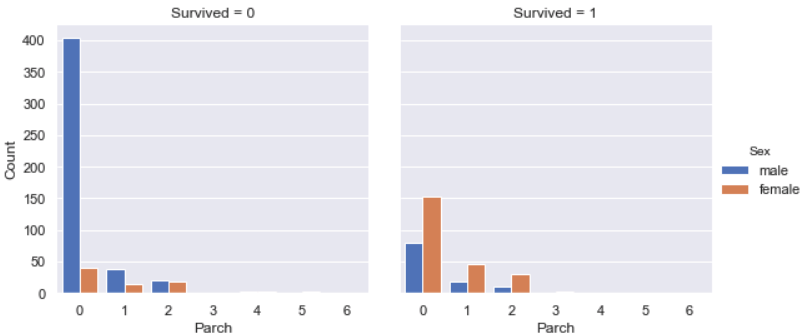
Among all survivals, the majority was female.
Age vs. Survived
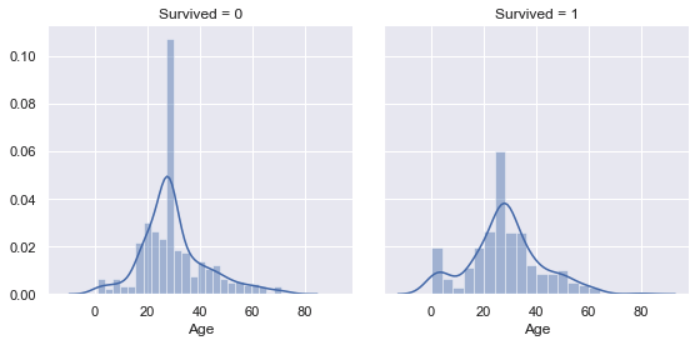
“Age” distribution is nearly a Normal distribution. We find that the most survived are the people around 25 year-old, which might because there were lots of younger on the board. However, people older than 50 year-old is less survived, which is not exactly same as analysis above. The graph below will explain why.
Age vs. Sex vs. Survived
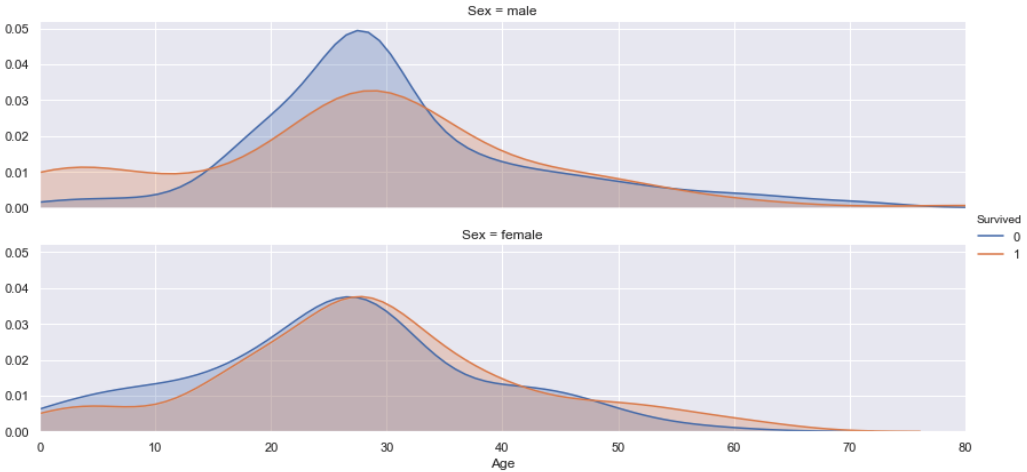
According to this plot, we find that both female and male passengers are nearly half survived, since the shadow surface of “Survived” and “Non-survived” are nearly the same. But the survived possibility is different on ages for female and male. For female passengers, the ones that older than 27 year-old have a little bit more chance to be survived than others. For male passengers, the one who is younger than 15 years old or older than 34 years old are more likely to be survived than men between 16 and 32 years old, which because they help other passengers to be alive.
Moreover, let’s pay attention to the passengers that were older than 50 year-old. According to the graph “Age vs. Survived” we find that people older than 50 year-old is less survived, which is not exactly same as correlation analysis. But from this graph we can easily understand why: most of older passengers were male, most of the older survival were female, and they were nearly all survived. So in fact, older female passengers had much more chance to be survived than older male passengers.
Pclass vs. Survived
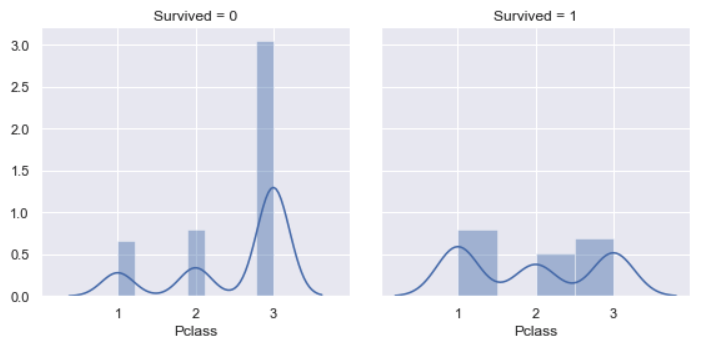
For the class of survived passengers, it’s almost same for each class, the possibility for class 1 is a bit more higher than others. However, non-survived probability of class 3 is 3 times of class 1 and class 2, respectively. This is coherent with analysis above.
Embarked vs. Survived
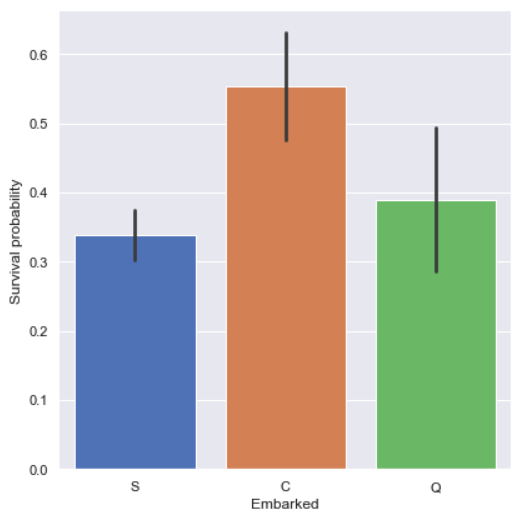
Passengers who came from Cherbourg (Embarked='C') had more chance to be
survived, so we’ll study why they were most survived in the following.
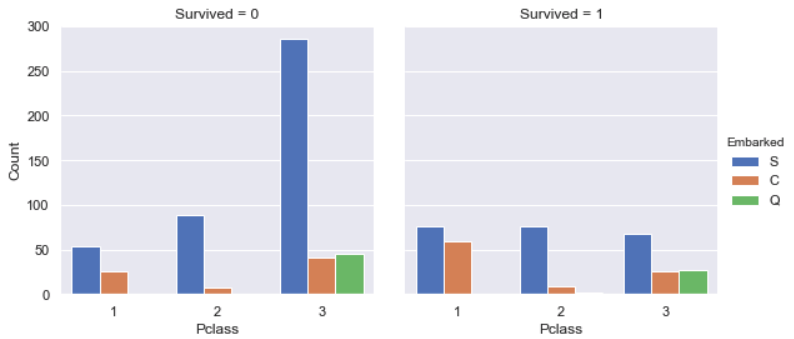
According to this graph, we find that the majority of passengers came from
Southampton (Embarked='S') and lots of them chose class 3 which decrease the
survived chance. However, the majority of passengers who came from Cherbourg
(Embarked='C') were in class 1, such their chance to be survived was more
than others, which is coherent with result above.
Train model
I trained data with SVM (Support-vector machine), Decision Trees, Random Forest, Logistic Regression, AdaBoost, Extra Trees, Gradient Boosting and Voting classifier (hard and soft), and compared their accuracy score:
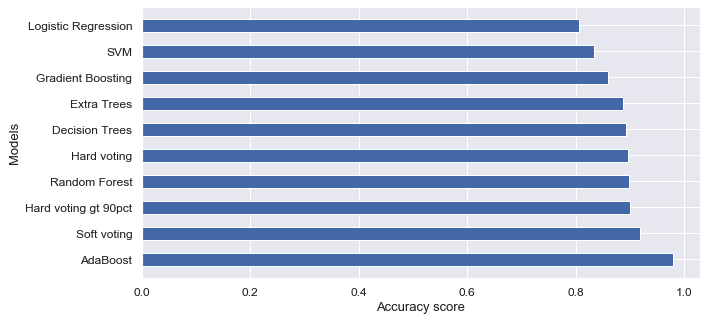
Finally I chose soft voting classifier in order to avoid the overfitting and applied it to predict survivals in test dataset.
You can find all codes in this notebook.
Reference
- Kaggle Competition: Titanic: Machine Learning from Disaster
- Introduction to Ensembling/Stacking in Python
- Titanic Top 4% with ensemble modeling
- An Interactive Data Science Tutorial
- handson-ml/03_classification.ipynb
- funnytools, “Giant downfall pleasure boat times”, pixabay.com. [Online]. Available: https://pixabay.com/photos/giant-downfall-pleasure-boat-times-510674/