Île-de-France is the most populous of the 18 regions of France. It is located in the north-central part of the country and often called the Région Parisienne (“Paris Region”) because it includes the city of Paris. Besides the landmarks of Paris, the region has many important historic sites, including the Palace of Versailles and the Palace of Fontainebleau, as well as the most-visited tourist attraction in France, Disneyland Paris. The poverty rate in Île-de-France was 15.9% in 2015, compared with 12.3% in 2006. The region is also increasingly unequal. Housing prices have pushed the less affluent outside Paris. In this blog, I’ll talk about the second-hand apartments purchases in Île-de-France between January 2014 and June 2020, with the following points:
- Data description
- How large are the apartments?
- Which is the most expensive district?
- Relationship between area & apartment price?
- Price evolution in terms of timing?
Data description
First of all, I downloaded real estate transactions’ data on the site of government. In the dataset, we have transaction’s information from January 2014 to June 2020, like “id_mutation” to identify the transaction, “nature_mutation” specifies the sale’s nature, “nombre_pieces_principales” indicates the number of rooms, “valeur_fonciere” presents the sold price, “code_commune”, “nom_commune” and “code_departement” specify the communities and departments, “surface_reelle_bati” describes the real surface area, longitude and latitude can help us to determine the location.
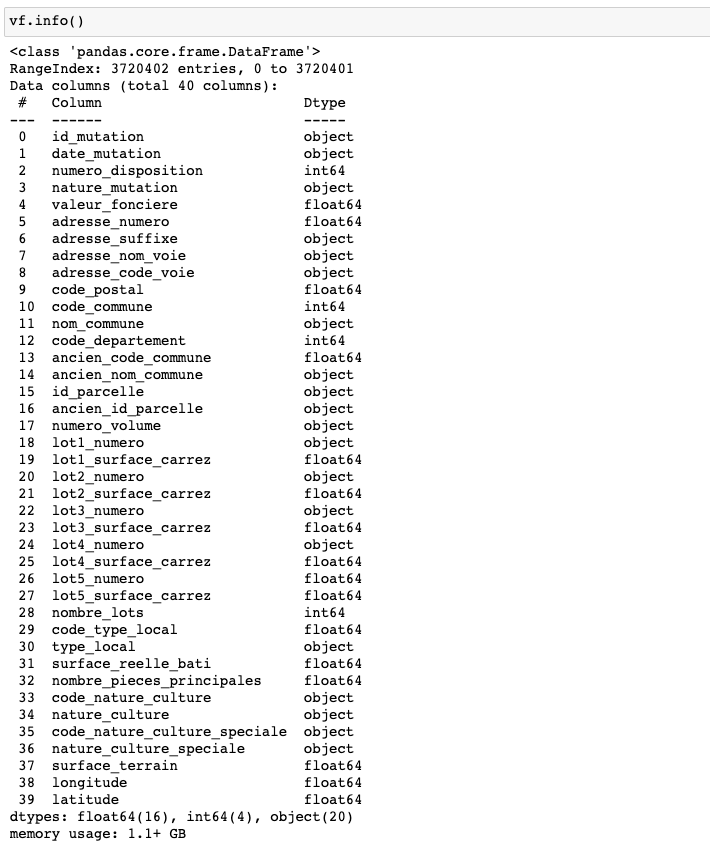
For this analysis, I only took account of second-hand apartments’ transactions with a positive area in Île-de-France.
How large are the apartments?
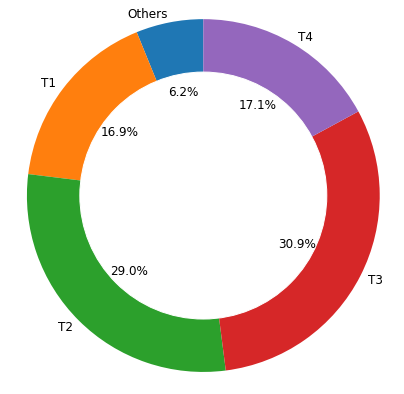
I classed second-hand apartments into 5 groups in terms of piece’s number: T1, which means one-room apartment with around 25 m2; T2, which means two-room apartment with around 40 m2; T3 presents three-room apartment around 60 m2; T4 are four-room apartments nearly 80 m2; T5 are five-room apartments larger than 100 m2. This donut chart describes the quote-part of different pieces’ apartment among the transactions. T2 and T3 hold nearly 60% of transactions, nearly 17% of transactions sold T1 apartments, other purchases are for larger apartments. Let’s go further on the details.
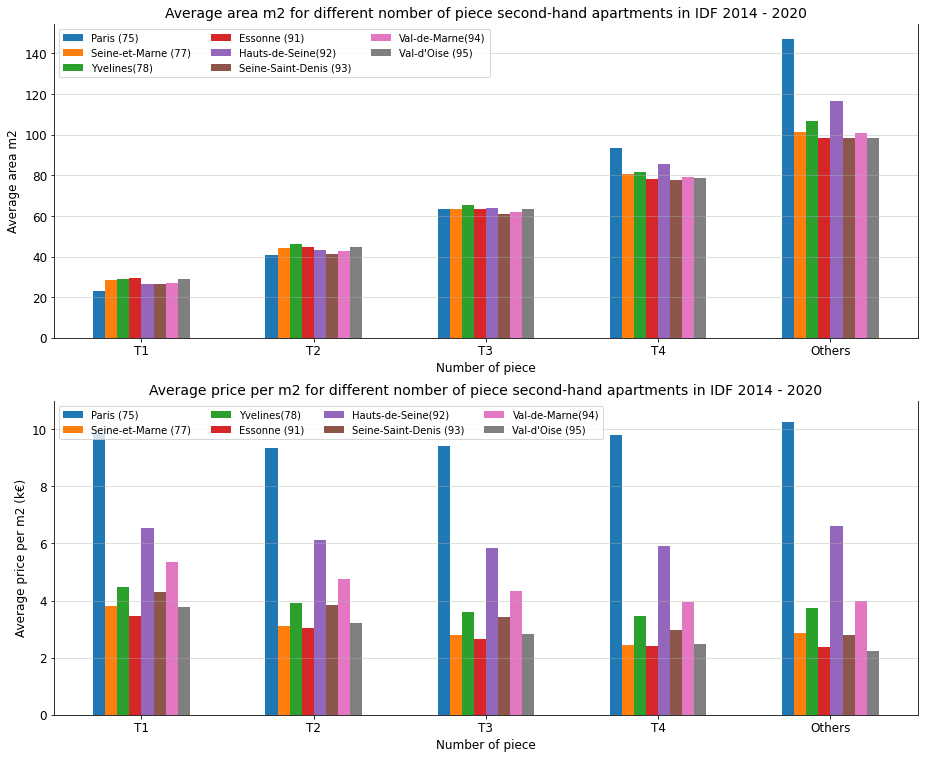
This graph describes the average price m2 for the different number of piece second-hand apartments in Ile-de-France, between January 2014 and June 2020. The average area of each class is similar in different departments. For the T1 and T2 apartments, the ones in Paris are smaller than other departments; however, the second-hand apartments of T4 or larger ones are larger than other departments.
According to the second graph, we find that although T2 and T3 are much larger than T1, their unit prices are lower than the unit price of T1: the gap in Paris is 5.4% and 4.7%, respectively, concerning T1; the gap in other departments is pretty large (11% and 19%). Moreover, the average area of T4 is three times larger than T1, its unit price is 24% less expensive than T1 on average; except for Paris, T4’s unit price is 1% more expensive than T1 in Paris. Why are T1 apartments that expensive per m2? That might be because there are many students or young workers, they need to rent a big enough apartment, which makes investors invest in T1 apartments, it also leads to higher demands on T1.
Which is the most expensive district?
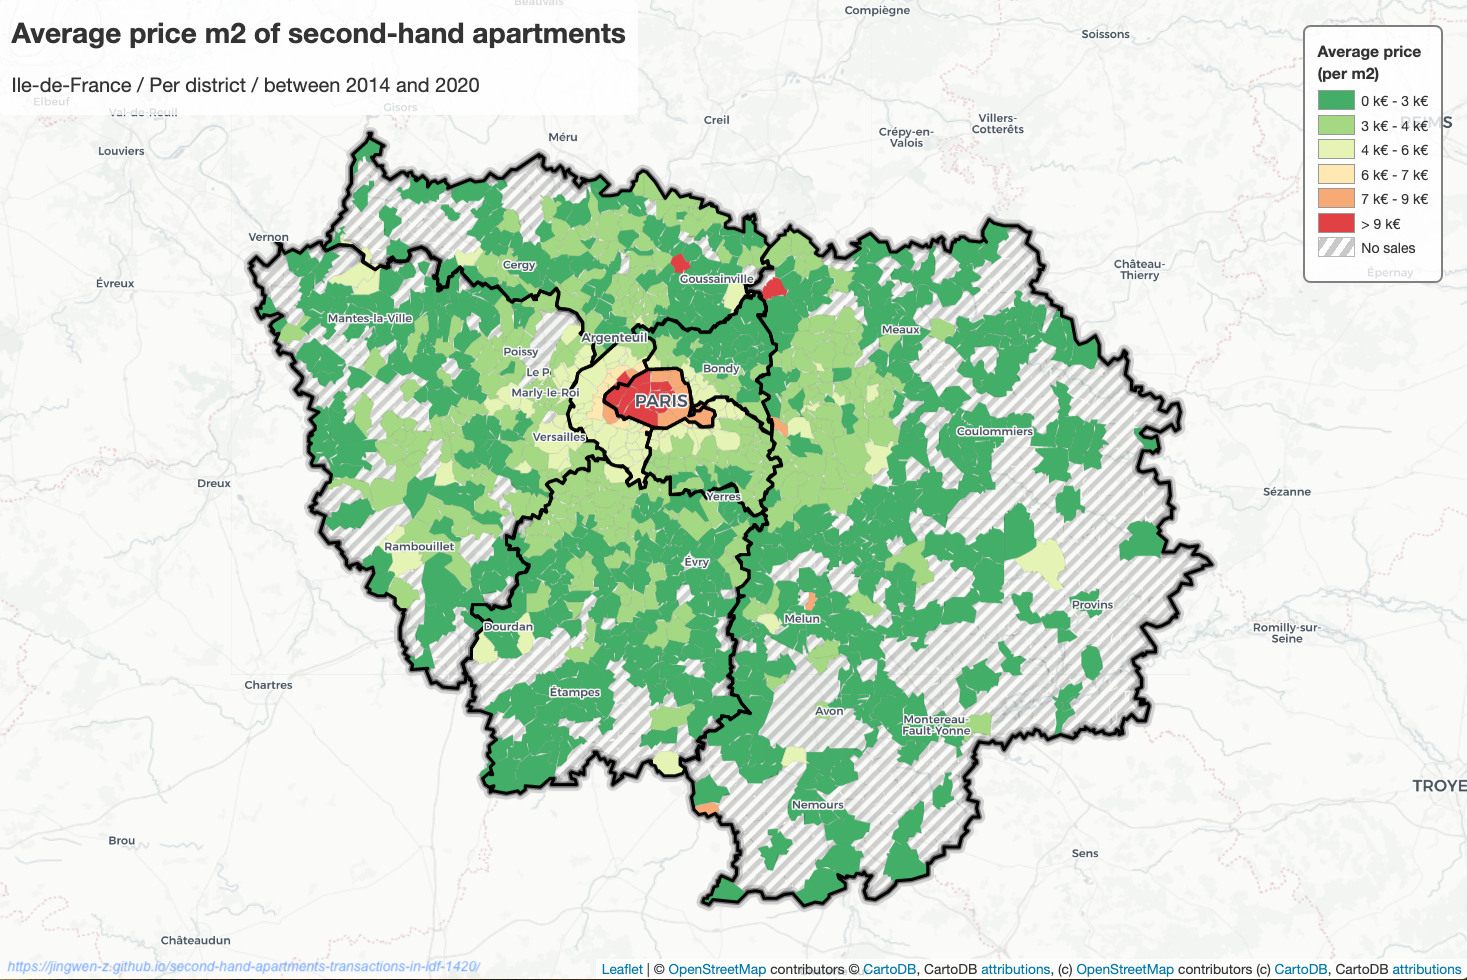
According to this map, we observe that the second-hand apartments in the center and west of Paris are more expensive( > 9k euros per m2) than other districts of Paris(7k - 9k euros per m2), the second-hand apartments in Paris are more expensive than other departments of IDF. Among the departments except for Paris, the second-hand apartments in Hauts-de-Seine are more expensive(4k - 6k euros per m2).
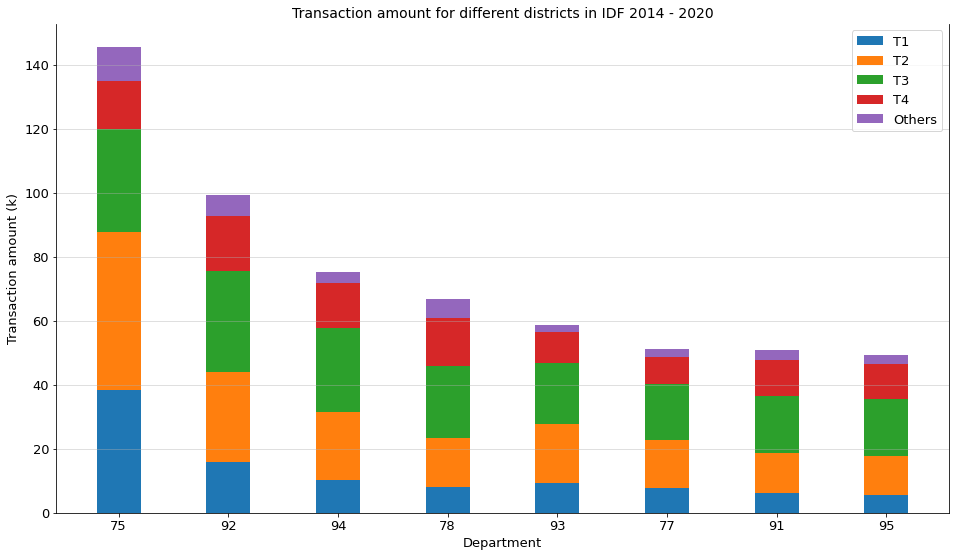
Furthermore, in the light of the stacked bar chart, it’s obvious that there are much more transactions in Paris, although it’s much more expensive than other departments, no matter which class of apartments. In Paris, 60% of transactions sold studio or 2-room apartment; but in other departments, the majority of transactions sold 2-room or 3-room apartments. One of the reasons might be the unit price in Paris is more expensive, the studio or 2-room apartment can satisfy the needs of people who live alone or in couple and satisfy the need for investors; on the contrary, people who live with family prefer the apartments outside Paris, they are larger and less expensive.
Relationship between area & apartment price?
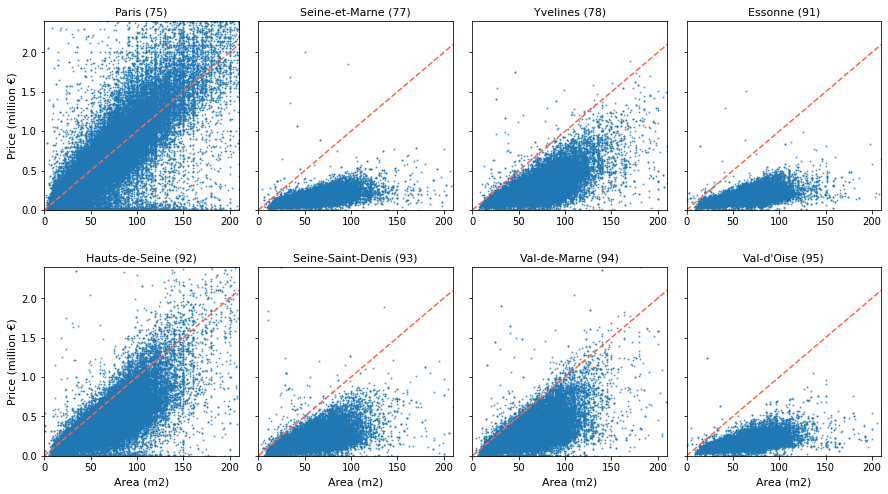
According to this group of scatter plots, we can simply get the relationship between second-hand apartments’ price and their area. Each point stands for one transaction, the plots on the red dash line mean that the price per m2 of these transactions is 10k euros. The points above the dashed line indicate their unit price is greater than 10k euros; otherwise, it’s less than 10k euros per m2.
For the transactions in Paris, most of the sold apartments are smaller than 150 m2, the unit price is around 10k euros per m2. However, for the transaction in other departments, most of the apartments are smaller than 100 m2, the unit price is lower than 10k euros per m2; especially in Seine-et-Marne(77), Essonne (91) and Val-d’Oise(95), we can even get a 100 m2 second-hand apartment with only 0.25 million euros, which is much cheaper than in other departments.
Price evolution in terms of timing?
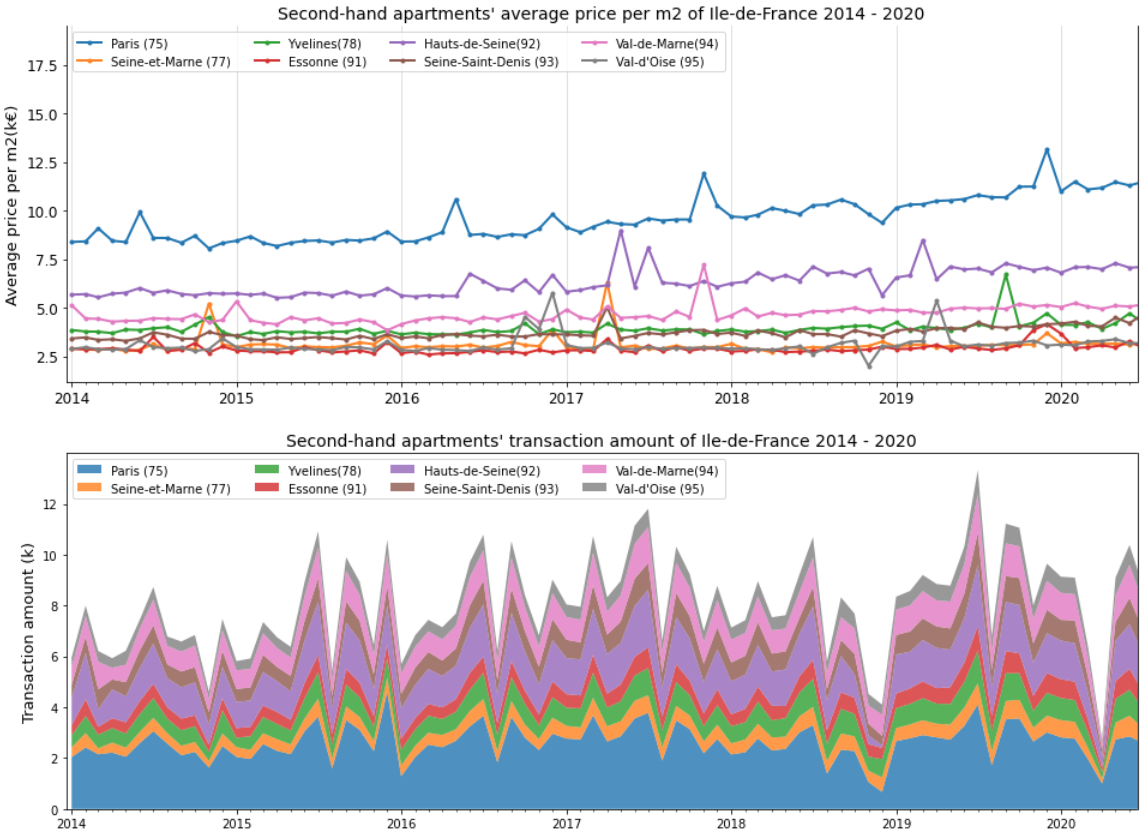
The line chart describes the second-hand apartments’ average price per m2 of Ile-de-France, between January 2014 and June 2020. Obviously, the average price in Paris is the highest in Ile-de-France and its evolution is the highest as well, which increased 36%(11.4/8.4 - 1). Besides, the average price in Hauts-de-Seine is the second highest in Ile-de-France, it increased 30% (7.3/5.6-1); and the average price in Val-de-Marne increased 21% (5.1/4.2-1); the average price of other departments in Ile-de-France doesn’t change a lot. Among 8 departments, the second-hand apartments are the most expensive in Paris until June 2020, which is 11k euros per m2, it’s 56% higher than the price in Hauts-de-Seine and twice more expensive than second-hand apartments in Val-de-Marne.
The stacked area plot presentsthe second-hand arpatments’ transaction amount of Ile-de-France, during the same period as the line chart. We can easily find that the transaction amount of Paris’ second-hand apartments is more than other department of IDF, which is nearly 30% of transactions in IDF. Following Paris, the transaction amount of Hauts-de-Seine and Val-de-Marne are the second and third greatest of IDF. The peak of Paris’s transaction is December 2015 (4612 transactions), for Hauts-de-Seine and Val-de-Marne is July 2019.
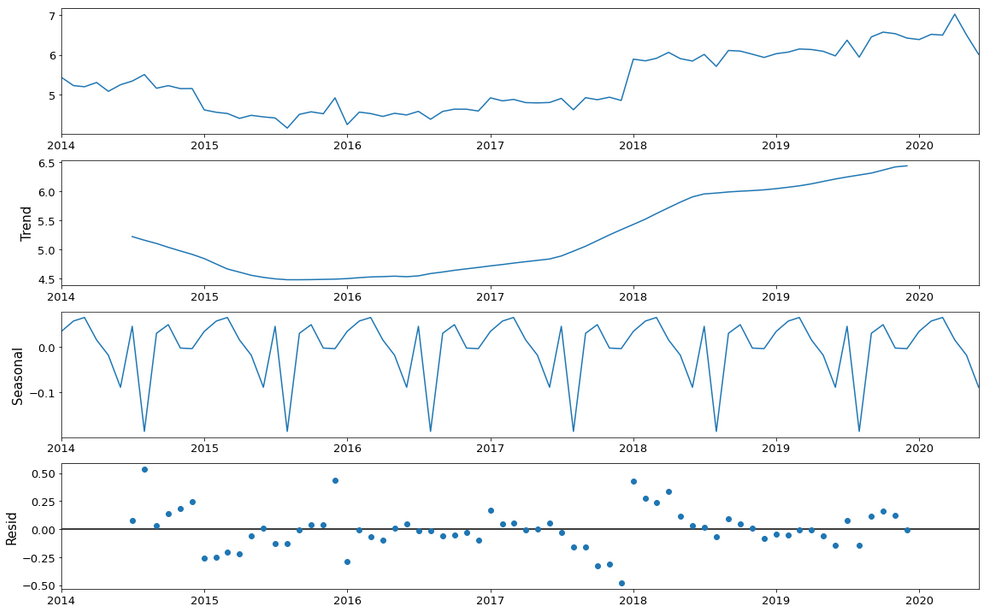
Then I used Time Series additive model to decompose data into a trend
component, a seasonal component, and a residual component. The trend component
captures changes over time, the seasonal component captures cyclical effects
due to the time of year, the residual component captures the influences not
described by the trend and seasonal effects. Thanks to this model, we find that
except for July, there is another transaction peak in March, which we didn’t
find above. In June and August, the transactions arrive at their low points,
that might be because, during the transition period between 2 months, the desire
for purchasing or selling apartments is not that high.
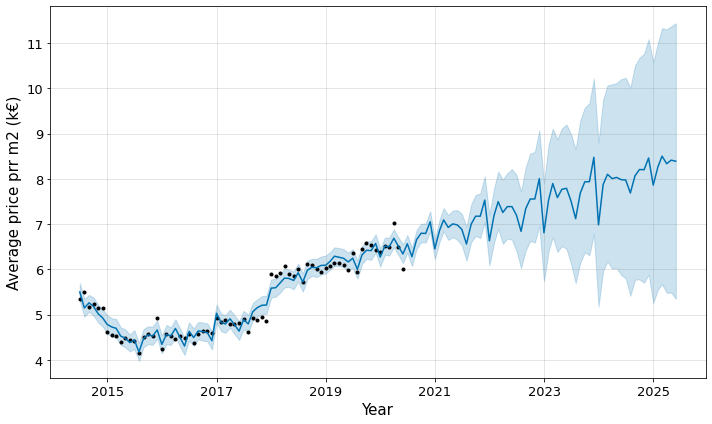
Moreover, I used fbprophet module to predict the price per m2. The black
points present actual values, the blue line indicates the forecasted values, and
the light blue shaded region is the uncertainty. The uncertainty’s region
increases for the prediction because of the initial uncertainty and it grows
over time. This can be impacted by policy, social elements, or some others.
Conclusion
According to this analysis, we find that among all transactions of second-hand apartments in Île-de-France, T2 and T3 hold 60% transactions. The second-hand apartments in the center and west of Paris are more expensive( > 9k euros per m2) than other districts of Paris(7k - 9k euros per m2), the second-hand apartments in Paris are more expensive than other departments of IDF. Among the departments except for Paris, the second-hand apartments in Hauts-de-Seine are more expensive(4k - 6k euros per m2).
You can find all codes in this notebook.
Reference
- DGFiP, “Demandes de valeurs foncières géolocalisées”, data.gouv.fr. [Online]. Available: https://www.data.gouv.fr/fr/datasets/demandes-de-valeurs-foncieres-geolocalisees/
- Grégoire David, “Departments polygon”, github.com. [Online]. Available: https://github.com/gregoiredavid/france-geojson/blob/master/departements.geojson
- APUR, “APUR : Communes - Ile de France”, data.gouv.fr. [Online]. Available: https://www.data.gouv.fr/fr/datasets/apur-communes-ile-de-france/
- “Île-de-France”, en.wikipedia.org. [Online]. Available: https://en.wikipedia.org/wiki/Paris
- Ehi Aigiomawu, “Analyzing time series data in Pandas”, towardsdatascience.com. [Online]. Available: https://towardsdatascience.com/analyzing-time-series-data-in-pandas-be3887fdd621
- Will Koehrsen, “Time Series Analysis in Python: An Introduction”, towardsdatascience.com. [Online]. Available: https://towardsdatascience.com/time-series-analysis-in-python-an-introduction-70d5a5b1d52a
- Pexels, “Paris gargoyle France architecture”, pixabay.com. [Online]. Available: https://pixabay.com/photos/paris-gargoyle-france-architecture-1852928/