Retail is the process of selling consumer goods or services to customers through multiple channels of distribution to earn a profit. Retailers satisfy demand identified through a supply chain. Most modern retailers typically make a variety of strategic level decisions including the type of store, the market to be served, the optimal product assortment, customer service, supporting services and the store’s overall market positioning. To point retailers in the right direction, they need to dig the retail metrics and KPIs to track in their business. In this blog, I’ll talk about the following pretty helpful KPIs for retailers:
- Turnover per square foot
- Year over year growth
- Customer retention rate
- Inventory turnover vs sell-through rate
- Break-Even Point
- Back Order Rate
Turnover per square foot
According to Tableau, we find that the turnover per square foot measures how effectively you’re using the area you have, and it is a good indicator of your store’s productivity while offering insights into store and merchandise layouts. If some product categories perform better than others, it may because of the types of products or their arrangement.
Turnover per square foot = Total turnover / Total square foot
Moreover, vend presents some tips for improving our turnover per square foot:
- Improve your store layout
- Have a winning product assortment
- Optimize your prices or promotions
- Increase transaction or basket value
- Train your staff to sell more
- Encourage people to stay longer in your shop
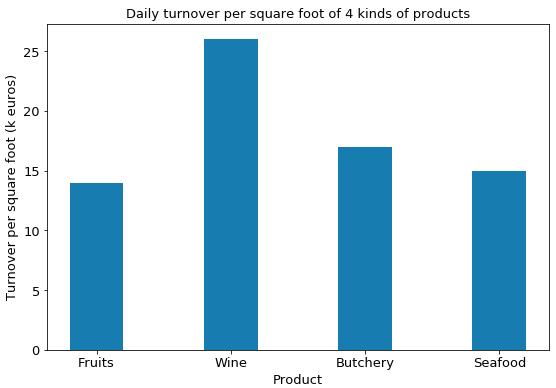
This plot shows the turnover per square foot of 4 kinds of products during one day, the value for the wine is higher than others since they are put on the multi-layer shelves, which is a good example of using spaces. Fruits’ turnover per square foot is the lowest among the four, because its unit price is lower, although its space utilization is better than the shelves of butchery and seafood. For the other two kinds of products, their space utilization is not enough, but their unit price is high, so their turnovers per square are not that low.
Year over year growth
Year-over-year growth is a comparison of a retail metric for one period to the same period the previous year. It calculates the percentage change during the past twelve months.
Year Over Year Growth = (Current year sales total – Previous year’s sales total) / Previous year’s sales total x 100
ehopper shows us an example that can help us to understand why the year over year growth is an important retail metric. Imagine that the retail revenue was up 20% in November concerning October, besides, you also need to check this number against the revenue from last November. If it’s also greater than the revenue of last November, that means your business is doing better.
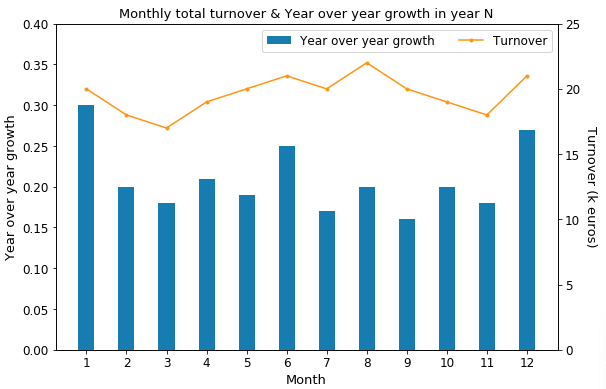
This plot shows the turnover and the year over year growth for each month, which helps us to identify if the increase of turnover is also significant vs. the last year.
Customer retention rate
Being able to attract new customers and to let them return is a relatively stable source for long-term profit. To understand if we have this source in our business, we can track the number of new customers versus repeat customers, and calculate the customer retention rate. There is a formula to calculate this KPI on the site of Tableau:
Customer retention rate = ((Total distinct customers at end of period) - (Total new distinct customers acquired during period)) / (Total distinct customers at start of period) x 100
Furthermore, vend presents some tips to improve our customer retention rate:
- Tracking customer purchases and offering personalized recommendations
- Developing meaningful relationships through amazing customer service as well as community-building efforts like classes, events, or online groups
- Implementing a killer loyalty program to encourage shoppers to keep coming back
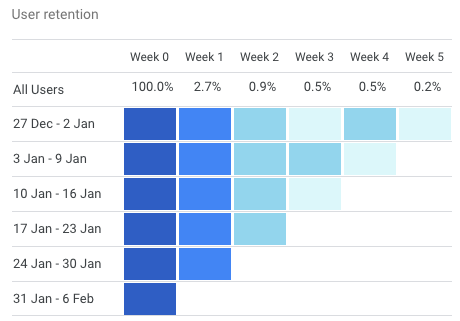
Here I take the example of Google Analytics of my blog, the idea is similar for e-commerce or physical stores. During the last 6 weeks, only 2.7% of visitors of week 0 were back in week 1, 0.9% were back in week 2, and so on.
Inventory turnover vs sell-through rate
Inventory turnover
In accounting, the Inventory turnover is a measure of the number of times inventory is sold or used in a period such as a year. It is calculated to see if a business has an excessive inventory in comparison to its sales level.
Inventory Turnover = Net sales / Average inventory at the selling price or Inventory Turnover = Cost of good sold / Average inventory at cost
where
Average inventory = (Beginning inventory + Ending inventory) / 2
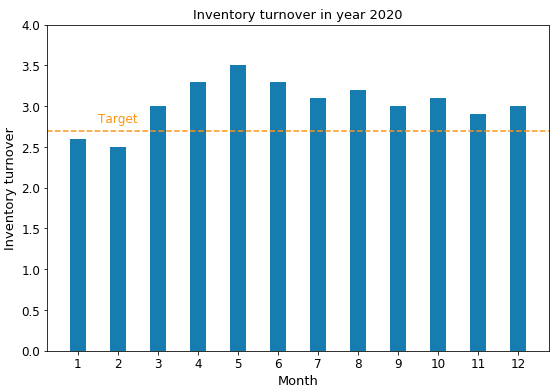
The target inventory turnover of 2020 is 2.7, which means the net sales is twice more than the average inventory at the selling price. Because of the lockdown, the sales had a high increase. which brings a high inventory turnover.
Sell-through rate
Sell-through rate refers to the percentage of a product that is sold by a retailer after being shipped by its supplier, typically expressed as a percentage. Sell-through is calculated during a period (usually 1 month).
Sell-Through Rate = Units Sold / Units Received
For example, imagine that you are the manager of a supermarket, you ordered 100 boxes of chocolate, but after 1 month only 20 boxes are sold, in this case, the sell-through rate is 20%, which means other 80% of chocolate are there for gathering dust :(
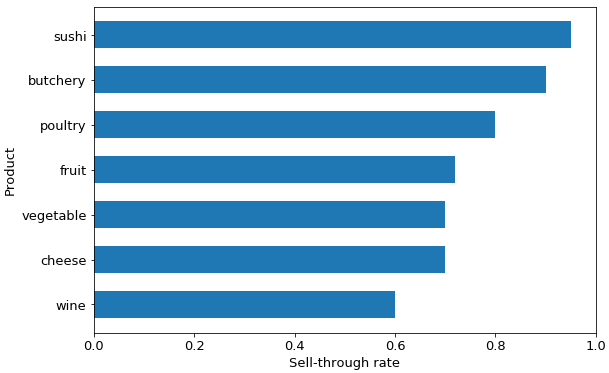
Among these 7 kinds of products, sushi’s sell-through rate is the highest since they can nearly all be sold the same day; on the contrary, the sell-through rate of the wine is lower than others since it’s not the daily aliment for everyone.
Break-Even Point
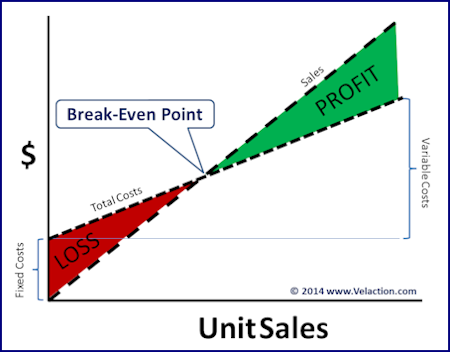
Break-even (or break even), often abbreviated as B/E in finance, is the point of balance making neither a profit nor a loss. Any number below the break-even point constitutes a loss while any number above it shows a profit. The term originates in finance but the concept has been applied in other fields.
Break-Even ($) = Fixed Costs / Gross Margin Percentage
Back Order Rate
The back order rate is the ratio between the number of orders that cannot be fulfilled at the moment the customer places an order and the total number of orders. A high back order rate means that your customers have to wait for more longer than assumed, which might have an impact on customers’ satisfaction and the customer retention rate.
datapine inserts this KPI into their dashboard to help retailers to measure the ability to fulfill customer orders, to identify why the related product has no enough stock, and to avoid the same problem in the future.
If you are curious about the scripts of the visualisation, you will find them here.
References
- “Retail”, en.wikipedia.org. [Online]. Available: https://en.wikipedia.org/wiki/Retail
- Francesca Nicasio, “Retail Metrics: 14 Essential KPIs for Tracking Your Business’ Performance”, www.vendhq.com. [Online]. Available: https://www.vendhq.com/blog/retail-metrics-and-kpis/
- “Retail Key Performance Indicators and Metrics”, www.datapine.com. [Online]. Available: https://www.datapine.com/kpi-examples-and-templates/retail
- “15 Fundamental KPI Retail Metrics [And How to Measure Them]”, ehopper.com. [Online]. Available: https://ehopper.com/guides/kpi-retail/
- Thomas Cesaroni, “9 KPIs Every Retail Manager Should Track”, toucantoco.com. [Online]. Available: https://toucantoco.com/blog/en/kpis-retail-manager/
- “Top 8 metrics for retail KPIs”, www.tableau.com. [Online]. Available: https://www.tableau.com/learn/articles/retail-industry-metrics-kpis
- “Inventory turnover”, en.wikipedia.org. [Online]. Available: https://en.wikipedia.org/wiki/Inventory_turnover
- “Sell-through”, en.wikipedia.org. [Online]. Available: https://en.wikipedia.org/wiki/Sell-through
- “Break-even”, en.wikipedia.org. [Online]. Available: https://en.wikipedia.org/wiki/Break-even
- “Economic Viability”, www.ruthtrumpold.id.au. [Online]. Available: http://www.ruthtrumpold.id.au/destech/?page_id=162
- ElasticComputeFarm, “supermarket stalls coolers market”, pixabay.com. [Online]. Available: https://pixabay.com/photos/supermarket-stalls-coolers-market-949913/