Retail is the process of selling consumer goods or services to customers through multiple channels of distribution to earn a profit. Retailers satisfy demand identified through a supply chain. Most modern retailers typically make a variety of strategic level decisions including the type of store, the market to be served, the optimal product assortment, customer service, supporting services and the store’s overall market positioning. To point retailers in the right direction, they need to dig the retail metrics and KPIs to track in their business. In this blog, I’ll talk about the following pretty helpful KPIs for retailers:
- Volume of transactions
- Turnover of transactions
- Transactions amount
- Average volume per transaction
- Average purchase value
- Purchase frequency
- Gross profit vs net profit
- Gross Margin Return On Investment (GMROI)
Volume of transactions
datapine uses this indicator in their dashboard. Transactions’ volume measures the number of units sold during a specific accounting period. It can help you to understand if some products are sold more than others in different periods or different zones.
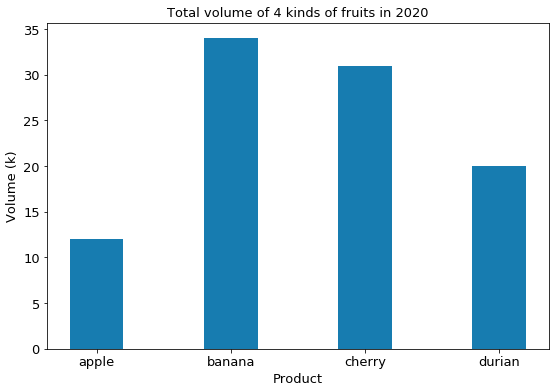
This plot describes the volume(k) for each fruit. Among four fruits, bananas’ sales are the largest (34k units), however, it seems that consumers don’t like apple that much.
Turnover of transactions
datapine uses this indicator in their dashboard. Transactions’ turnover measures the value of sales during a specific period. It can help you to understand if some products bring more value than others in different periods or different zones.
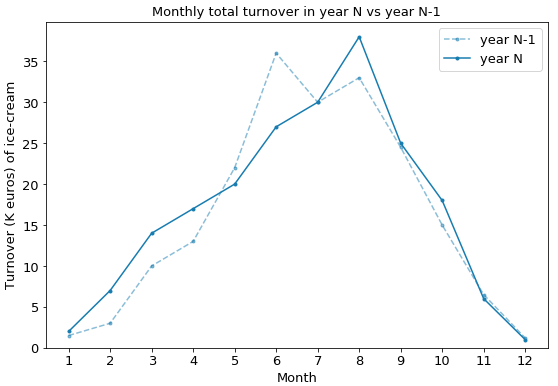
This plot compares two-year turnover together. The peak for both year is in the summer, for year N, the peak is in August; however, the peak is reached in June in the year N-1, which is caused by the heatwave in June.
Transactions amount
This is a pretty straightforward metric that datapine uses in their dashboard. The transaction amount calculates how many orders have been placed in your business over the day, month or year. It will help you in knowing when the peak periods are and adapt your stock inventory accordingly, to avoid any stock-out or backorder.
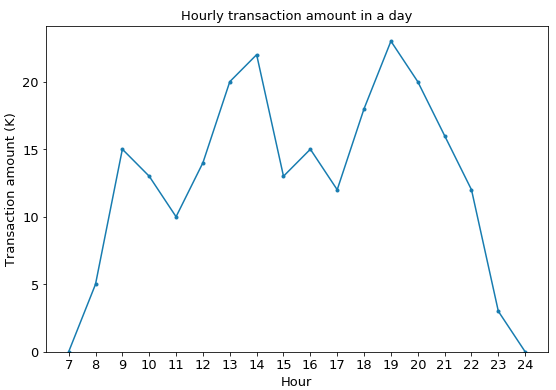
According to this plot, it’s obvious that the peak in a day is around noon and after work like 19h, because customers work in the morning and afternoon, they have time to shopping during the noon and after work. Moreover, there are 2 small peaks around 9h and 16h, that might because customer come to buy their breakfast and classes over around 16h.
Average volume per transaction
eHopper talks about this indicator on their website. We can measure this KPI to track things like product sales over time, it helps us to ascertain if an increasing turnover means you are selling more products, or if customers are buying more costly products.
Average volume per transaction = Total transaction volume / Transactions amount
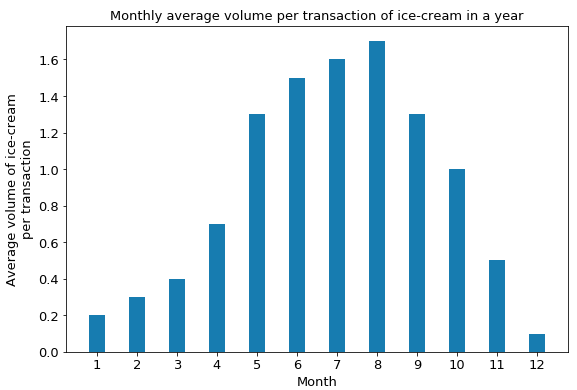
This plot shows the average volume per transaction of ice-cream. Logically, the volume increases with temperature increasing.
Average purchase value
toucantoco talks about this indicator in his blog. Average purchase value measures the average value of each transaction made by customers. Retailers can understand sales’ trend with this measure, they can also combine it with average volume per sale to ascertain if an increasing turnover means you are selling more products, or if customers are buying more costly products.
Average purchase value = Total purchase value / Transactions amount
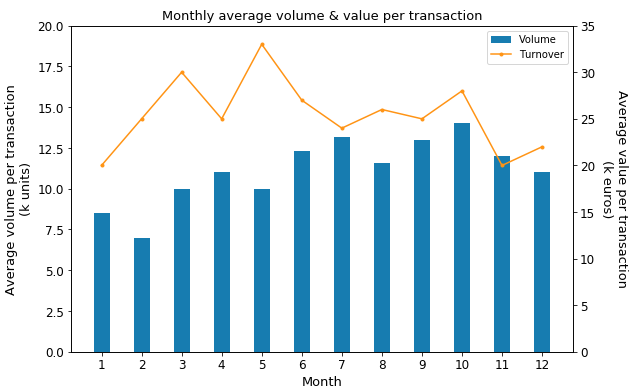
This plot describes the average volume and average value per sale during 12 months. We find that when the average volume per sale increases, the average value does not always increase. For instance, the average volume of April is more than March, but the average value is less, which means customers buy more units during their purchase, but the price per unit is decreasing.
Purchase frequency
Purchase frequency measures how many times a customer does purchase during a given period. The evolution of the purchase frequency does not represent directly the sales’ value becomes more or less, we should understand it with some other KPIs like average volume per transaction or average purchase value.
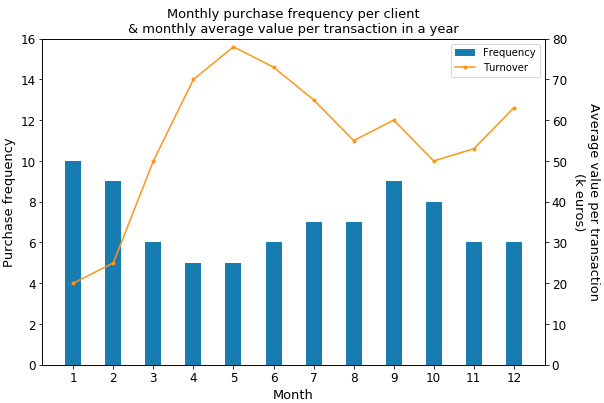
Imagine that this plot shows the performance of some supermarkets in France in 2020. The purchase frequency reduces because of the lockdown for COVID-19, however, the average value per sale doubles. Thus, although the frequency reduces, the total turnover doesn’t become less by analysing the average value per sale.
Gross profit vs net profit
Both eHopper and vend talk about these 2 KPIs. The gross profit tells you how much you made after deducting the costs of creating and selling the product. The net profit tells you how much you made after deducting your cost of goods along with all other business expenses — including administrative costs, operating expenses, etc.
gross profit = total revenue – cost of goods sold (COGS)
net profit = gross profit – all expenses
Gross profit and net profit help you to understand your business and to make better decisions. For example, if your gross profit is much higher than net profit, you can look into your operating expenses or all other expenses, and check if they are reasonable.
Gross Margin Return On Investment (GMROI)
Both tableau and datapine talk about these 2 KPIs. Gross Margin Return on Investment (GMROI) measures your profit return on the funds invested in the stock. What this means in practice is that for every euro you spend in your stock, this KPI can tell you how many euros you get back so that you apply it on specified products to measure if they are worth stocking.
GMROI = gross profit / average inventory cost
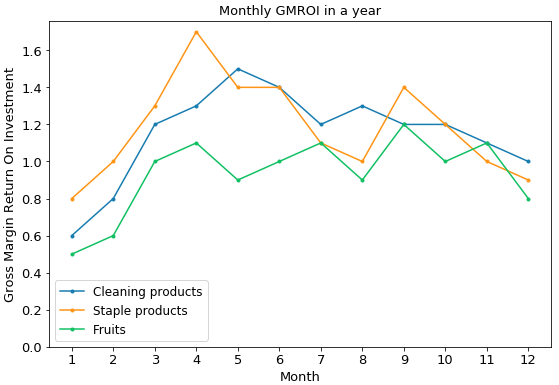
This plot describes the GMROI of 3 groups of products (cleaning products, staple products and fruits) of 2020. All of them increase since March because of the COVID-19 lockdown, customers were willing to buy more cleaning products to keep clean, to buy more staple products and fruits since they need to cook at home and to keep the dietary balance.
If you are curious about the scripts of the visualisation, you will find them here.
References
- “Retail”, en.wikipedia.org. [Online]. Available: https://en.wikipedia.org/wiki/Retail
- Francesca Nicasio, “Retail Metrics: 14 Essential KPIs for Tracking Your Business’ Performance”, www.vendhq.com. [Online]. Available: https://www.vendhq.com/blog/retail-metrics-and-kpis/
- “Retail Key Performance Indicators and Metrics”, www.datapine.com. [Online]. Available: https://www.datapine.com/kpi-examples-and-templates/retail
- “15 Fundamental KPI Retail Metrics [And How to Measure Them]”, ehopper.com. [Online]. Available: https://ehopper.com/guides/kpi-retail/
- Thomas Cesaroni, “9 KPIs Every Retail Manager Should Track”, toucantoco.com. [Online]. Available: https://toucantoco.com/blog/en/kpis-retail-manager/
- “Top 8 metrics for retail KPIs”, www.tableau.com. [Online]. Available: https://www.tableau.com/learn/articles/retail-industry-metrics-kpis
- Alexas_Fotos, “Minion banana fruit healthy”, pixabay.com. [Online]. Available: https://pixabay.com/photos/minion-banana-fruit-healthy-1168873/