In the blog UCSD Introduction to Big Data Week 1 & 2 review, we talked about three sources of Big Data and the characteristics of Big Data. Today, I’ll go on with it and talk about the process of data analysis and Hadoop.
The Process of Data Analysis
Acquire Data
Acquire includes anything that makes us retrieve data including; finding, accessing, acquiring, and moving data. It includes identification of and authenticated access to all related data. And transportation of data from sources to distributed files systems. It includes waste subset to match the data to regions or times of interest. As we sometimes refer to it as geo-spacial query.
Prepare Data
The next activity is prepare data, we divide the pre-data activity. Into two steps based on the nature of the activity. Namely, explore data and pre-process data.
-
Explore: The first step in data preparation involves literally looking at the data to understand its nature, what it means, its quality and format. It often takes a preliminary analysis of data, or samples of data, to understand it. This is why this step is called explore.
-
Pre-process: Once we know more about the data through exploratory analysis, the next step is pre-processing of data for analysis. Pre-processing includes cleaning data, sub-setting or filtering data, creating data, which programs can read and understand, such as modeling raw data into a more defined data model, or packaging it using a specific data format. If there are multiple data sets involved, this step also includes integration of multiple data sources, or streams.
Analyze Data
The prepared data then would be passed onto the analysis step, which involves selection of analytical techniques to use, building a model of the data, and analyzing results. This step can take a couple of iterations on its own or might require data scientists to go back to steps one and two to get more data or package data in a different way.
Communicate Results
Step four for communicating results includes evaluation of analytical results. Presenting them in a visual way, creating reports that include an assessment of results with respect to success criteria. Activities in this step can often be referred to with terms like interpret, summarize, visualize, or post process.
Apply Results
The last step brings us back to the very first reason we do data science, the purpose. Reporting insights from analysis and determining actions from insights based on the purpose you initially defined is what we refer to as the act step.
We have now seen all the steps in a typical data science process. Please note that this is an iterative process and findings from one step may require the previous step to be repeated with new information.
Hadoop Ecosystem
How did the big data open-source movement begin? In 2004 Google published a paper about their in-house processing framework they called MapReduce. The next year, Yahoo released an open-source implementation based on this framework called Hadoop. In the following years, other frameworks and tools were released to the community as open-source projects.
Today, there are over 100 open-source projects for big data and this number continues to grow. Many rely on Hadoop, but some are independent. With so many frameworks and tools available, how do we learn what they do?
We can organize them with a layer diagram to understand their capabilities. Sometimes we also used the term stock instead of a layer diagram.
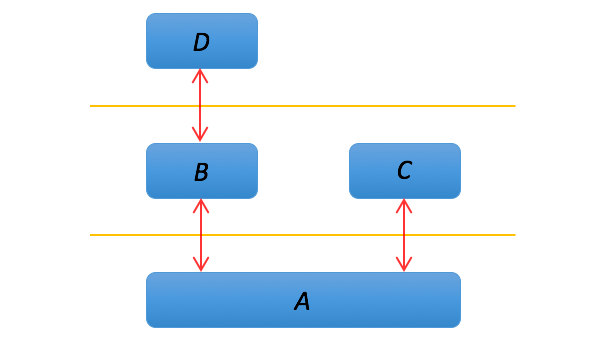
In a layer diagram, a component uses the functionality or capabilities of the components in the layer below it. Usually components at the same layer do not communicate. And a component never assumes a specific tool or component is above it. In this example, component A is in the bottom layer, which components B and C use. Component D uses B, but not C, and D does not directly use A.
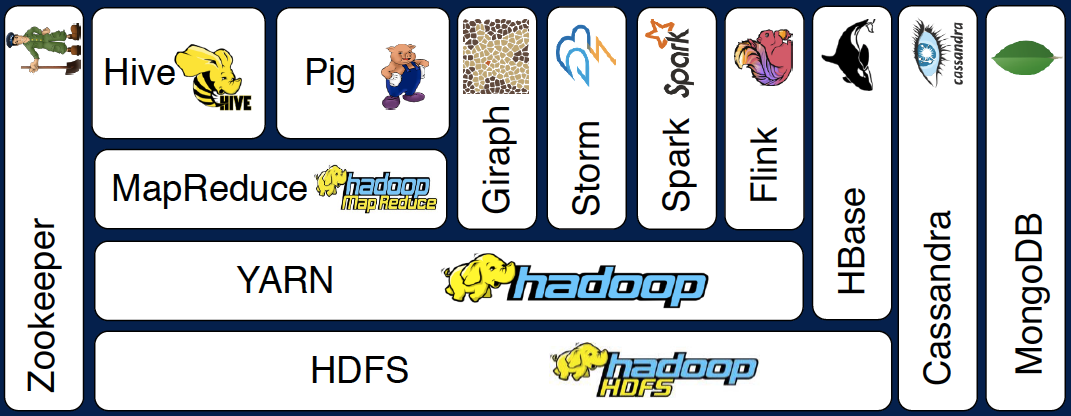
Let’s look at one set of tools in the Hadoop ecosystem as a layer diagram. This layer diagram is organized vertically based on the interface. Low level interfaces, so storage and scheduling, on the bottom. And high level languages and interactivity at the top.
HDFS
The Hadoop distributed file system, or HDFS, is the foundation for many big data frameworks, since it provides scaleable and reliable storage. As the size of your data increases, you can add commodity hardware to HDFS to increase storage capacity so it enables scaling out of your resources.
YARN
Hadoop YARN provides flexible scheduling and resource management over the HDFS storage. YARN is used at Yahoo to schedule jobs across 40,000 servers.
MapReduce
MapReduce is a programming model that simplifies parallel computing. Instead of dealing with the complexities of synchronization and scheduling, you only need to give MapReduce two functions, map and reduce, as you heard before. This programming model is so powerful that Google previously used it for indexing websites.
Hive & Pig
MapReduce only assume a limited model to express data. Hive and Pig are two additional programming models on top of MapReduce to augment data modeling of MapReduce with relational algebra and data flow modeling respectively. Hive was created at Facebook to issue SQL-like queries using MapReduce on their data in HDFS. Pig was created at Yahoo to model data flow based programs using MapReduce.
Giraph
Thanks to YARN stability to manage resources, not just for MapReduce but other programming models as well. Giraph was built for processing large-scale graphs efficiently. For example, Facebook uses Giraph to analyze the social graphs of its users.
Storm, Spark & Flink
Similarly, Storm, Spark, and Flink were built for real time and in memory processing of big data on top of the YARN resource scheduler and HDFS. In-memory processing is a powerful way of running big data applications even faster, achieving 100x’s better performance for some tasks.
HBase, Cassandra & MongoDB
Sometimes, your data or processing tasks are not easily or efficiently represented using the file and directory model of storage. Examples of this include collections of key-values or large sparse tables. NoSQL projects such as Cassandra, MongoDB, and HBase handle these cases. Cassandra was created at Facebook, but Facebook also used HBase for its messaging platform.
Zookeeper
Finally, running all of these tools requires a centralized management system for synchronization, configuration and to ensure high availability. Zookeeper performs these duties. It was created by Yahoo to wrangle services named after animals.
As a summary, the Hadoop ecosystem consists of a growing number of open-source tools. Providing opportunities to pick the right tool for the right tasks for better performance and lower costs.
Well, here is the knowledge that I share with you of Introduction to Big Data. In the next few weeks, I will talk about other courses of Big Data.