The COVID-19 pandemic is still around the world, we need to do a COVID-19 test
if you feel that you have the symptom or you need to travel abroad. There are
some testing sites in different communities. Inspired by Boris’ portfolio,
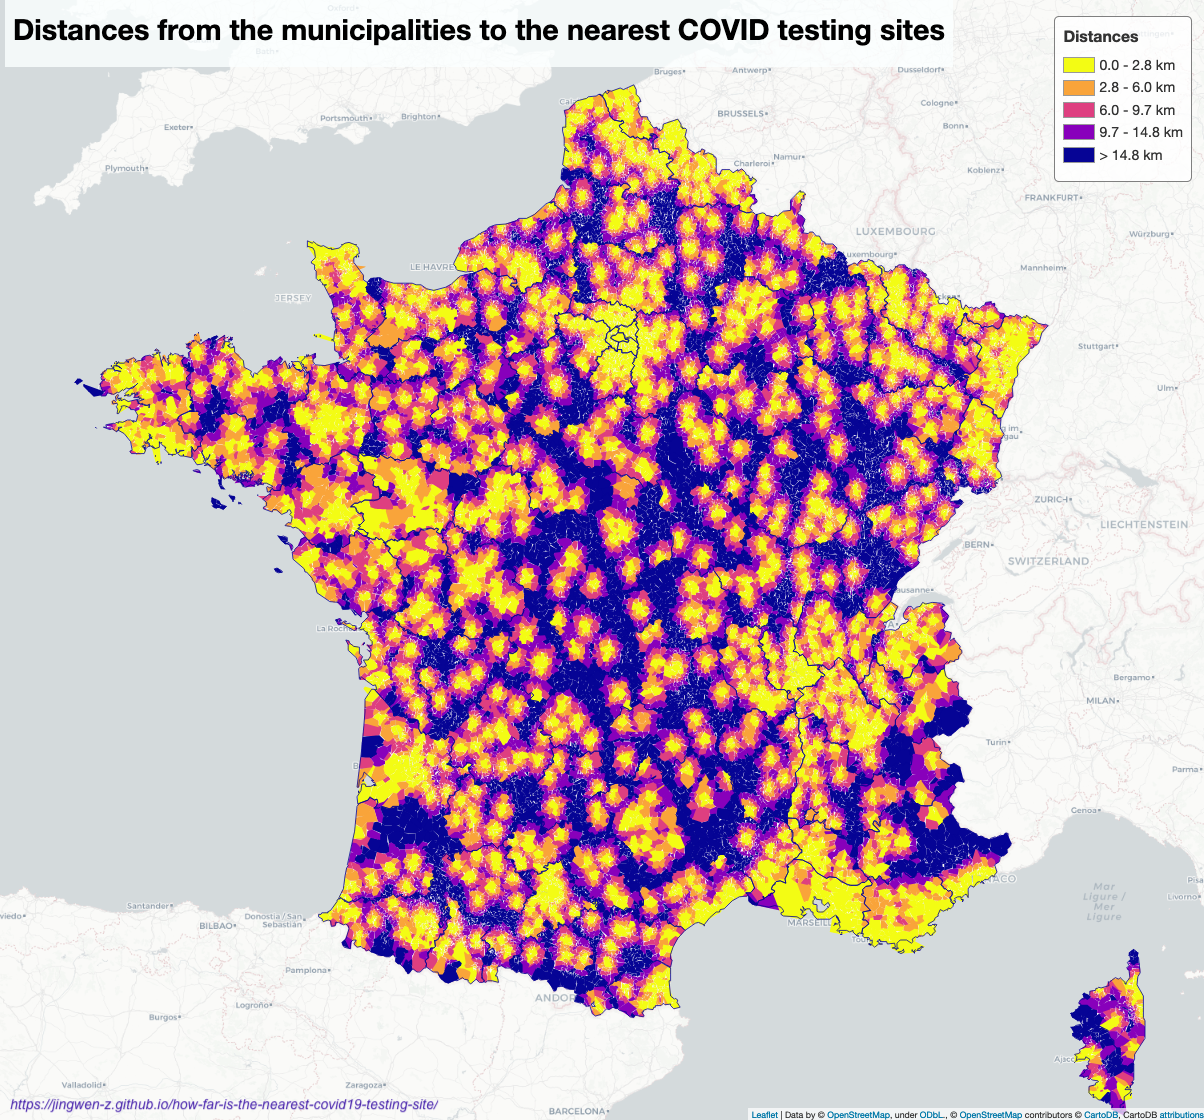
I created the map above with folium and shapely modules of python, which
allows us to see the distance to the nearest COVID-19 testing site.
In the following part, I’ll talk about how to draw this map by python folium
and shapely modules with the following points:
- Data preparation
- Geovisualization
Data preparation
Import datasets
First of all, we need sites’ location, communities’ and departments’ polygon data to draw areas on the map.
sites_df = pd.read_csv('sites-prelevements-grand-public.csv')
dept_geo = gpd.read_file('departements.geojson', driver='GeoJSON')
commune_geo = gpd.read_file('communes.geojson', driver='GeoJSON')
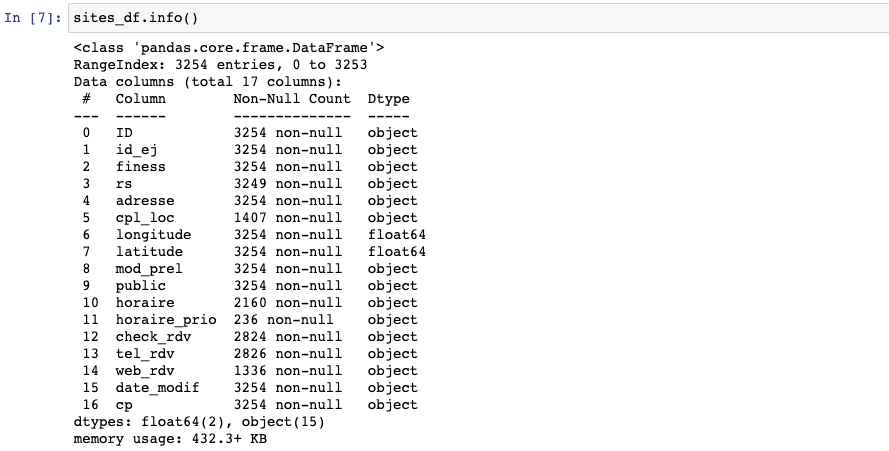
In the site-location dataset, we have data like “ID” to identify sites, “cp” specifies the store’s zip code, longitude and latitude can help us to determine the location.
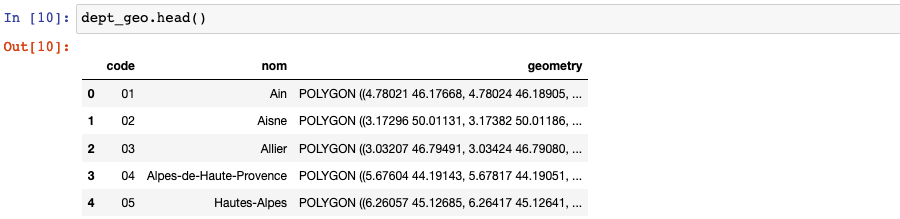
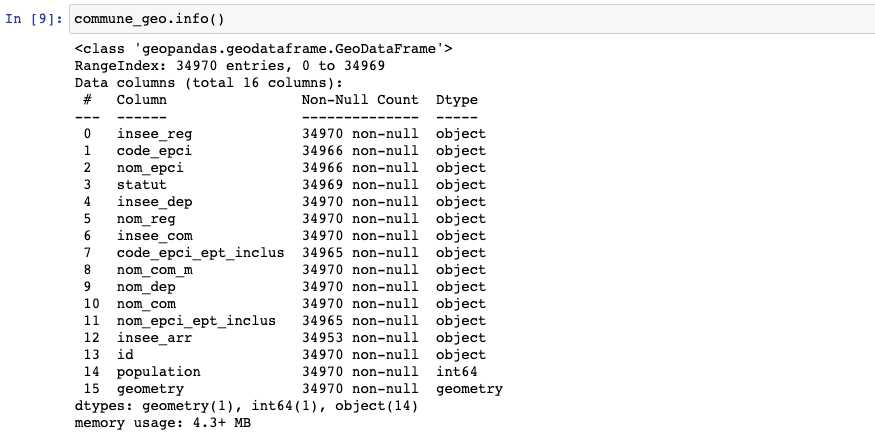
For the polygon data, we only need “code” and “insee_com” to match the department and community, and “geometry” to draw polygons.
Data cleaning
Before calculating the distance between each store and community, we need to find their department code, so for the department that contains stores, we will only calculate the distance between the department’s stores and department’s border; for the department without stores, we will calculate the distance between each store and department’s border.
sites_df['CP'] = sites_df['CP'].apply(lambda x: ('00000%d' % x)[-5:])
sites_df['code_dept'] = sites_df['cp'].apply(lambda x: x[:2])

sites_geometry = [Point(xy) for xy in zip(sites_df.longitude, sites_df.latitude)]
crs = {'init': 'epsg:4326'}
sites_gdf = gpd.GeoDataFrame(sites_df, crs=crs, geometry=sites_geometry)
Since some communities have the same name in different departments, I also created a column to combine them.
commune_geo['nom_dept_com'] = commune_geo.apply(lambda row: row['nom_dep'] + ':' + row['nom_com'],
                                                axis='columns')
Distance calculating
To find the shortest distance between a testing site and a community, the idea
is that creating a dictionary, put “nom_dept_com” as keys and distance as
values; update distance if the existing one is greater than the new one. For
calculating the distance, I applied the boundary.distance() function.
def fill_dist_dict(commune_polygon, site_point, nom_dept_com, dist_dict):
    dist = commune_polygon.boundary.distance(site_point)
    if not nom_dept_com in dist_dict:
        dist_dict[nom_dept_com] = dist
    else:
        if dist < dist_dict[nom_dept_com]:
            dist_dict[nom_dept_com] = dist
    return dist_dict


def calcul_shortest_distance(insee_dep, commune_polygon, nom_dept_com, store_dept, dist_dict, sites_gdf):
    if insee_dep in store_dept:
        dist_dict = sites_gdf[
            sites_gdf['code_dept'] == insee_dep].apply(lambda row:fill_dist_dict(commune_polygon,
                                                                                 row['geometry'],
                                                                                 nom_dept_com,
                                                                                 dist_dict),
                                                       axis='columns')
    else:
        dist_dict = sites_gdf.apply(lambda row:fill_dist_dict(commune_polygon,
                                                              row['geometry'],
                                                              nom_dept_com,
                                                              dist_dict),
                                    axis='columns')

    return dist_dict

site_dept = sites_gdf.code_dept.unique()
dist_dict = {}

dist_dict = commune_geo.apply(lambda row:calcul_shortest_distance(row['insee_dep'],
                                                                  row['geometry'],
                                                                  row['nom_dept_com'],
                                                                  site_dept,
                                                                  dist_dict,
                                                                  sites_gdf),
                              axis='columns')

commune_geo['shortest_distance'] = commune_geo['nom_dept_com'].map(dist_dict.iloc[0, 0])
Moreover, I applied convex_hull to avoid gaps between two polygons.
commune_visu_gdf['geometry_hull'] = commune_visu_gdf.geometry.convex_hull
Geovisualization
I’ve talked about the elements of geovisualization in this blog, so I’ll simply show my codes here:
colormap_commune = cm.StepColormap(
    colors=['#f3fc14', '#f9a43a', '#de3f80',
            '#8800bb', '#060495'],
    vmin=min(commune_visu_gdf['shortest_distance_km']),
    vmax=max(commune_visu_gdf['shortest_distance_km']),
    index=[0, 2.8, 6, 9.7, 14.8,
           round(commune_visu_gdf['shortest_distance_km'].max(), 0)])

sites_map = folium.Map(location=[46.803354, 1.8883335], zoom_start = 7)
folium.TileLayer('cartodbpositron').add_to(sites_map)

style_function = lambda x: {
    'fillColor': colormap_commune(x['properties']['shortest_distance_km']),
    'color': '',
    'weight': 0,
    'fillOpacity': 1
}

folium.GeoJson(commune_visu_gdf,
               style_function = style_function,
               name='Commune').add_to(sites_map)

folium.GeoJson(dept_geo,
               style_function = lambda x: {
                   'color': '#060495',
                   'weight': 1,
                   'fillOpacity': 0},
               name='Departement').add_to(sites_map)

for i,r in sites_gdf.iterrows():
    folium.CircleMarker(location=[r.latitude, r.latitude],
                        radius=1,
                        color='black',
                        fill_color='black',
                        fill=True).add_to(sites_map)

macro = MacroElement()
macro._template = Template(template)
macro2 = MacroElement()
macro2._template = Template(template_title)

sites_map.get_root().add_child(macro)
sites_map.get_root().add_child(macro2)
If you are interested in detailed python codes behind the graph, here you are :)
Reference
- “Sites de prélèvements pour les tests COVID”, www.data.gouv.fr. [Online]. Available: https://www.data.gouv.fr/fr/datasets/sites-de-prelevements-pour-les-tests-covid/
- Grégoire David, “Departments polygon”, github.com. [Online]. Available: https://github.com/gregoiredavid/france-geojson/blob/master/departements.geojson
- Mike T, “Distance from point to polygon when inside”, stackoverflow.com. [Online]. Available: https://stackoverflow.com/questions/36972537/distance-from-point-to-polygon-when-inside
- Diogo Caribé, “Python Shapely - filling small gaps between multi polygons”, gis.stackexchange.com. [Online]. Available: https://gis.stackexchange.com/questions/201378/python-shapely-filling-small-gaps-between-multi-polygons