Content
- Project understanding
- Objectif
- Practice skills
- Python packages to be applied
- Data description
- Data cleaning
- Data analysis
- Train models
- Reference
Project understanding
Ask a home buyer to describe their dream house, and they probably won’t begin with the height of the basement ceiling or the proximity to an east-west railroad. But this playground competition’s dataset proves that much more influences price negotiations than the number of bedrooms or a white-picket fence.
With 79 explanatory variables describing (almost) every aspect of residential homes in Ames, Iowa, this competition challenges you to predict the final price of each home.
Objectif
It is your job to predict the sales price for each house. For each Id in the test set, you must predict the value of the SalePrice variable.
Practice skills
- Creative feature engineering
- Advanced regression techniques like random forest and gradient boosting
Python packages to be applied
import pandas as pd
import numpy as np
import matplotlib.pyplot as plt
import seaborn as sns

from scipy.stats import skew, boxcox_normmax
from scipy.special import boxcox1p
from sklearn.model_selection import train_test_split, KFold, cross_val_score
from sklearn.metrics import mean_squared_error

from sklearn.base import BaseEstimator, TransformerMixin
from sklearn.pipeline import Pipeline, FeatureUnion, make_pipeline
from sklearn.impute import SimpleImputer
from sklearn.preprocessing import LabelEncoder, StandardScaler, RobustScaler

from sklearn.linear_model import LinearRegression, Ridge, Lasso, ElasticNet, ElasticNetCV, LassoCV, RidgeCV
from sklearn.svm import SVR, LinearSVR
from sklearn.ensemble import GradientBoostingRegressor
from xgboost import XGBRegressor
Data description
print('Dimension train_df:', train_df.shape)
print('Dimension test_df:', test_df.shape)
# Dimension train_df: (1460, 81)
# Dimension test_df: (1459, 80)

train_df.info()
# <class 'pandas.core.frame.DataFrame'>
# RangeIndex: 1460 entries, 0 to 1459
# Data columns (total 81 columns):
# Id               1460 non-null int64
# MSSubClass       1460 non-null int64
# MSZoning         1460 non-null object
# LotFrontage      1201 non-null float64
# LotArea          1460 non-null int64
# Street           1460 non-null object
# Alley            91 non-null object
# LotShape         1460 non-null object
# LandContour      1460 non-null object
# Utilities        1460 non-null object
# LotConfig        1460 non-null object
# LandSlope        1460 non-null object
# Neighborhood     1460 non-null object
# Condition1       1460 non-null object
# Condition2       1460 non-null object
# BldgType         1460 non-null object
# HouseStyle       1460 non-null object
# OverallQual      1460 non-null int64
# OverallCond      1460 non-null int64
# YearBuilt        1460 non-null int64
# YearRemodAdd     1460 non-null int64
# RoofStyle        1460 non-null object
# RoofMatl         1460 non-null object
# Exterior1st      1460 non-null object
# Exterior2nd      1460 non-null object
# MasVnrType       1452 non-null object
# MasVnrArea       1452 non-null float64
# ExterQual        1460 non-null object
# ExterCond        1460 non-null object
# Foundation       1460 non-null object
# BsmtQual         1423 non-null object
# BsmtCond         1423 non-null object
# BsmtExposure     1422 non-null object
# BsmtFinType1     1423 non-null object
# BsmtFinSF1       1460 non-null int64
# BsmtFinType2     1422 non-null object
# BsmtFinSF2       1460 non-null int64
# BsmtUnfSF        1460 non-null int64
# TotalBsmtSF      1460 non-null int64
# Heating          1460 non-null object
# HeatingQC        1460 non-null object
# CentralAir       1460 non-null object
# Electrical       1459 non-null object
# 1stFlrSF         1460 non-null int64
# 2ndFlrSF         1460 non-null int64
# LowQualFinSF     1460 non-null int64
# GrLivArea        1460 non-null int64
# BsmtFullBath     1460 non-null int64
# BsmtHalfBath     1460 non-null int64
# FullBath         1460 non-null int64
# HalfBath         1460 non-null int64
# BedroomAbvGr     1460 non-null int64
# KitchenAbvGr     1460 non-null int64
# KitchenQual      1460 non-null object
# TotRmsAbvGrd     1460 non-null int64
# Functional       1460 non-null object
# Fireplaces       1460 non-null int64
# FireplaceQu      770 non-null object
# GarageType       1379 non-null object
# GarageYrBlt      1379 non-null float64
# GarageFinish     1379 non-null object
# GarageCars       1460 non-null int64
# GarageArea       1460 non-null int64
# GarageQual       1379 non-null object
# GarageCond       1379 non-null object
# PavedDrive       1460 non-null object
# WoodDeckSF       1460 non-null int64
# OpenPorchSF      1460 non-null int64
# EnclosedPorch    1460 non-null int64
# 3SsnPorch        1460 non-null int64
# ScreenPorch      1460 non-null int64
# PoolArea         1460 non-null int64
# PoolQC           7 non-null object
# Fence            281 non-null object
# MiscFeature      54 non-null object
# MiscVal          1460 non-null int64
# MoSold           1460 non-null int64
# YrSold           1460 non-null int64
# SaleType         1460 non-null object
# SaleCondition    1460 non-null object
# SalePrice        1460 non-null int64
# dtypes: float64(3), int64(35), object(43)
# memory usage: 924.0+ KB
Data cleaning
There are missing data in “LotFrontage”, “Alley”, “MasVnrType”, “MasVnrArea”, “BsmtQual”, “BsmtCond”, “BsmtExposure”, “BsmtFinType1”, “BsmtFinType2”, “Electrical”, “FireplaceQu”, “GarageType”, “GarageYrBlt”, “GarageFinish”, “GarageQual”, “GarageCond”, “PoolQC”, “Fence” and “MiscFeature”.
Among these fields,
- 94% data of “Alley” are missing.
- 47% data of “FireplaceQu” are missing.
- 99.5% data of “PoolQC” are missing.
- 81% data of “Fence” are missing.
- 96% data of “MiscFeature” are missing.
So we will ignore them during the analysis.
What should we do on missing data of other fields? We might replace null by median value or mode value.
Data analysis
Relationship between “SalePrice” and numeric fields
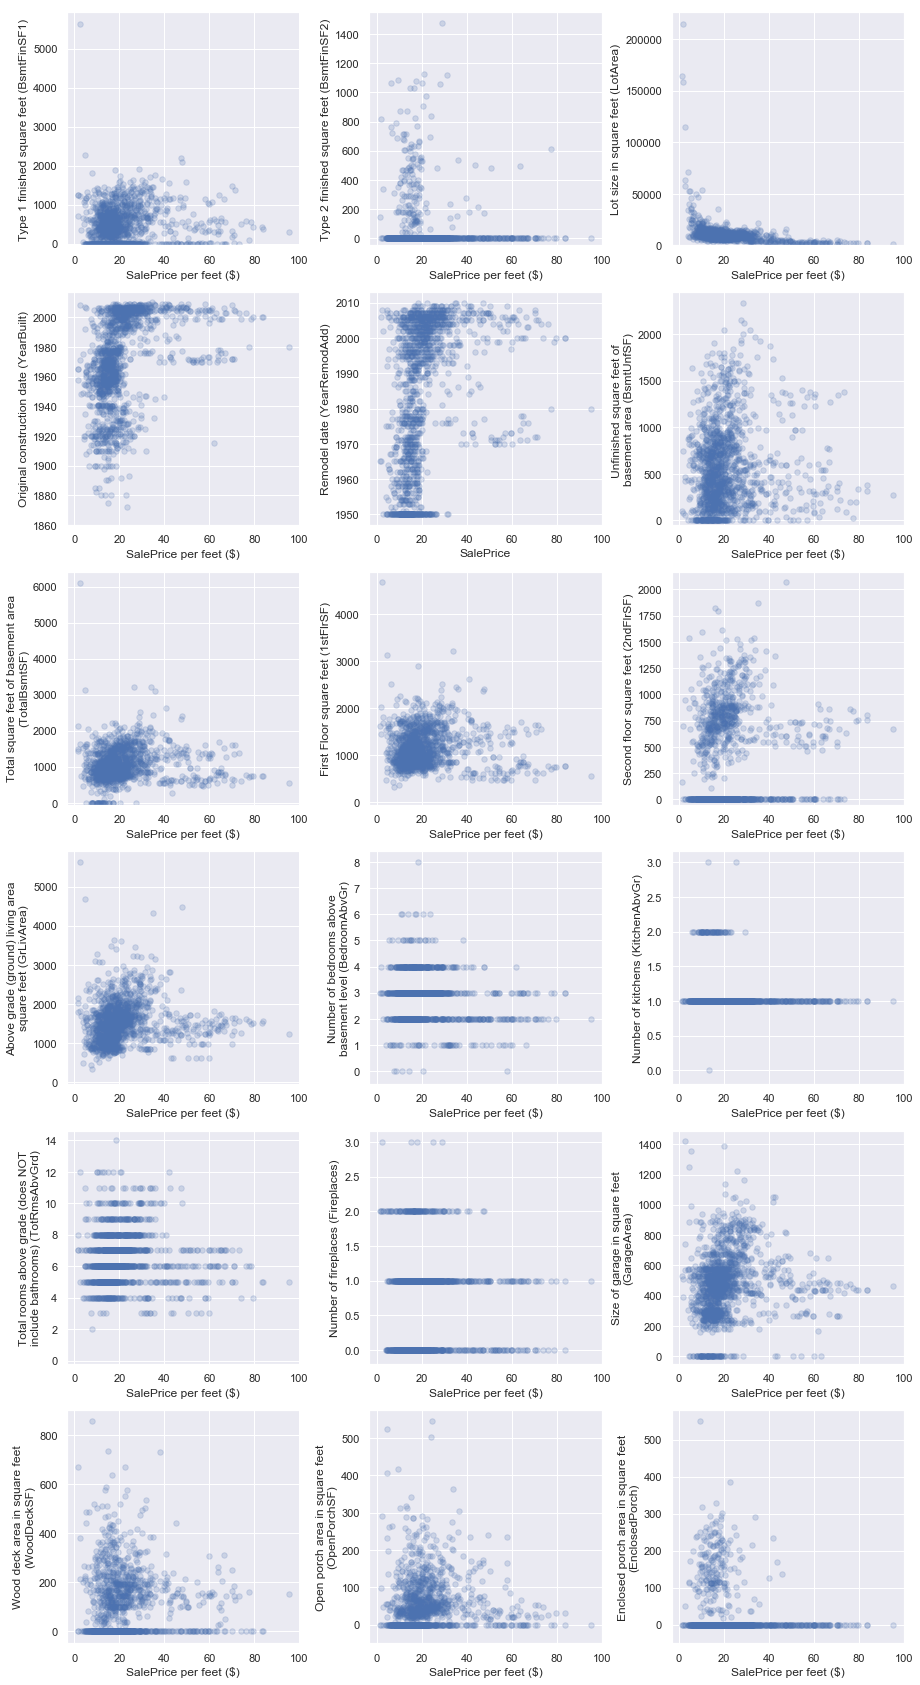
I take parts of numeric values, show the relationship between “SalePrice per square feet” and each of them:
- The more recent construction / remodel is, the higher “SalePrice per square feet” is.
- The more total rooms above grade is, the higher “SalePrice per square feet” is.
- The larger lot size (LotArea) is, the cheaper “SalePrice per square feet” is.
- For the lot whose total basement area is not larger than 40 square feet, the larger total basement area is, the cheaper “SalePrice per square feet” is; for the lot whose total basement area is larger than 40 square feet, the “SalePrice per square feet” is between 500$ and 2000$. For the lot whose above grade (groud) living area is not larger than 40 square feet, the large above grade (groud) living area is, the higher “SalePrice per square feet” is; for the lot whose above grade (ground) living area is larger than 40 square feet, the “SalePrice per square feet” is between 500$ and 2000$.
- Etc.
Relationship between “SalePrice_per_squareFeet” and category fields
“SalePrice_per_squareFeet” vs. “1MSSubClass”
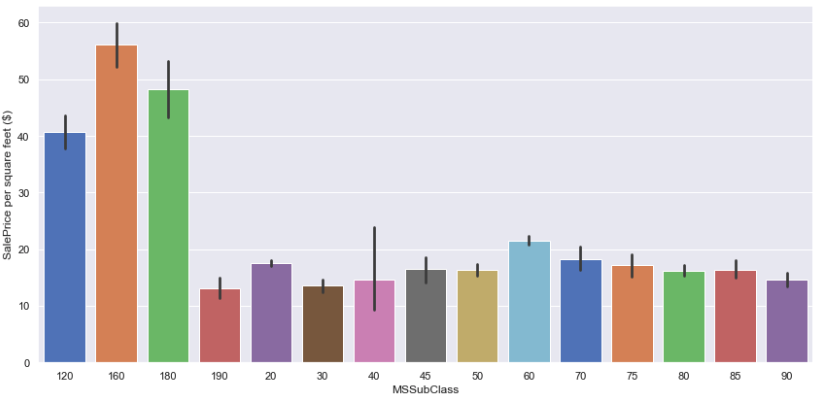
Among all building classes, the first three most expensive classes are “2-STORY PUD - 1946 & NEWER”, “PUD - MULTILEVEL - INCL SPLIT LEV/FOYER” and “1-STORY PUD (Planned Unit Development) - 1946 & NEWER”.
“SalePrice_per_squareFeet” vs. “MSZoning”
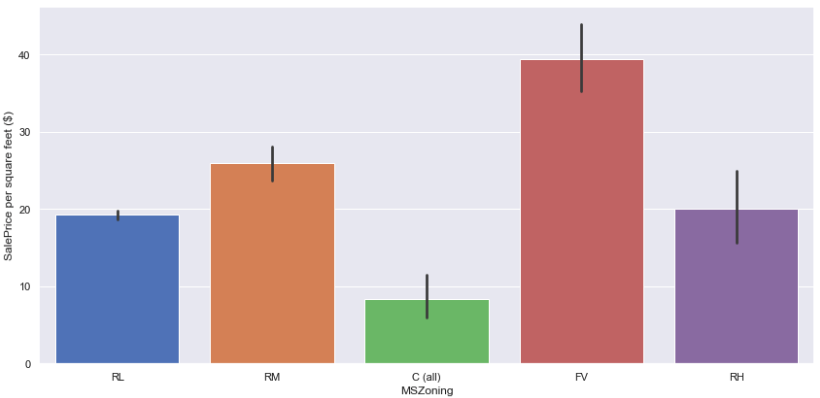
The graph above studies the sale price per square feet in terms of general zoning classification. Among these 5 zoning classes, the sale price per square feet of “Floating Village Residential (FV)” is the most expensive, the zoning classes which are less expensive are “Residential Medium Density (RM)”, “Residential High Density (RH)” and “Residential Low Density (RL)”, the sale price per square feet of “Commercial (C)” is the cheapest among the 5 classes.
Considering the construction’s difficulty and their rarity, we can obviously understand why the sale price per square feet of “Floating Village Residential (FV)” is the most expensive. However, there are less restrictions on the “Commercial” class, so it’s the cheapest class.
“SalePrice_per_squareFeet” vs. “LotShape”
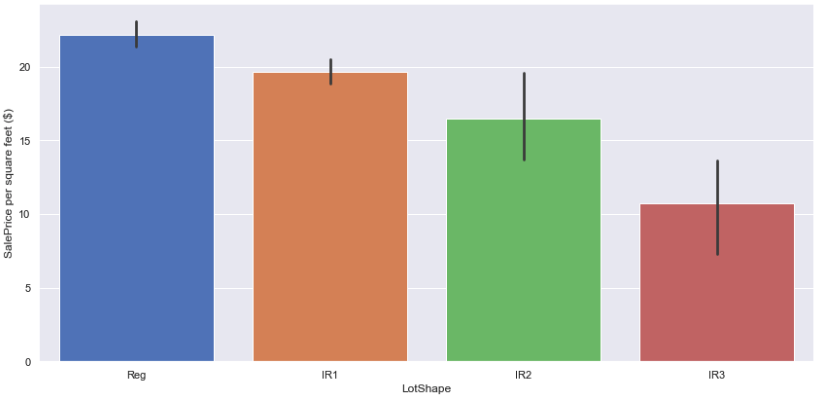
The relationship between General shape of property (LotShape) and the sale price per square feet is easily to understand: people usually like regular shape (Reg) of property, since it’s simple for the overall arrangement and more comfortable for living.
“SalePrice_per_squareFeet” vs. “Utilities”
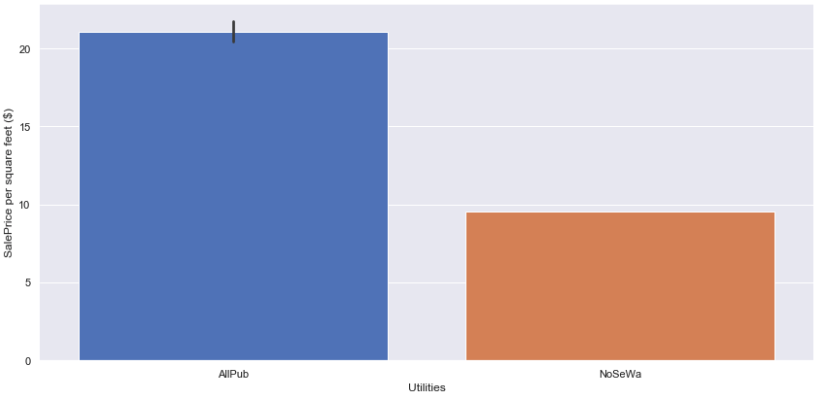
The result of this plot is interesting: we all know the more complete utilities are, the more expensive per square feet is. Except this point, we also get the price per square feet of a property whose all public utilities are available is double of the square feet-price of a property that only electricity and gas are available.
“SalePrice_per_squareFeet” vs. “LotConfig”
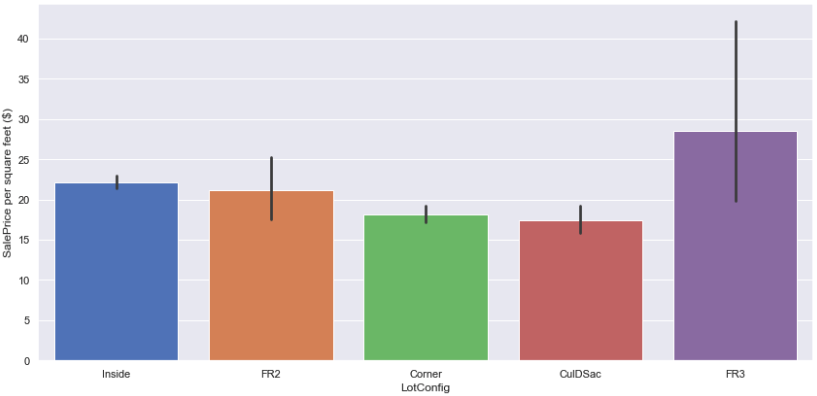
Considering the lightness, the ventilation and the view, the lot with “Frontage on 3 sides of property” is the best, so its price per square feet is the most expensive among the 5 configurations. On the contrary, the lot which is located as a Cul-de-sac, its price per square feet is the cheapest.
“SalePrice_per_squareFeet” vs. “Neighborhood”
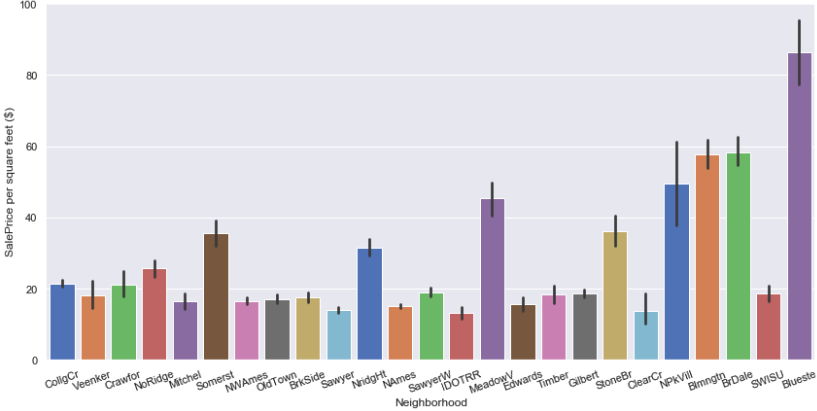
Considering the economic / political / geographical reasons, if a lot is located near Bluestem, its price per square feet is nearly 90 dollars; moreover, if the lot is located near Bloomington Heights or Briardale, its price per square feet is about 60 dollars. However, if the lot is located near Clear Creek, its unit price is only about 15 dollars.
“SalePrice_per_squareFeet” vs. “OverallQual”
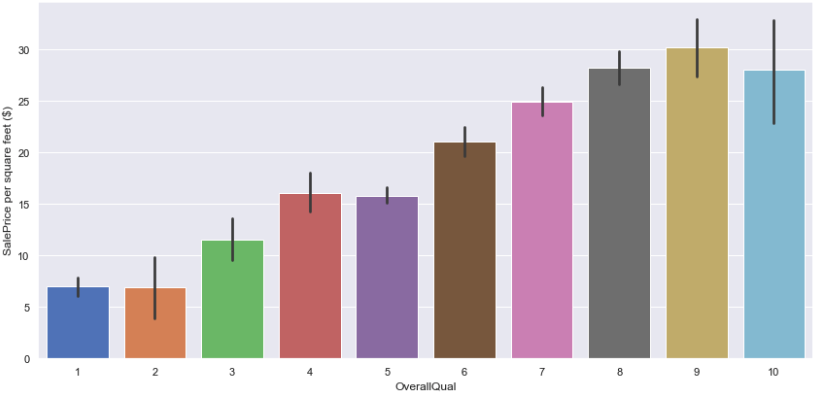
The better the overall material is, the more expensive the lot is. The interesting point is the median value of square feet price of “very excellent” lot is a little bit lower than “excellent” ones, but its variance is more than others.
“SalePrice_per_squareFeet” vs. “RoofMatl”
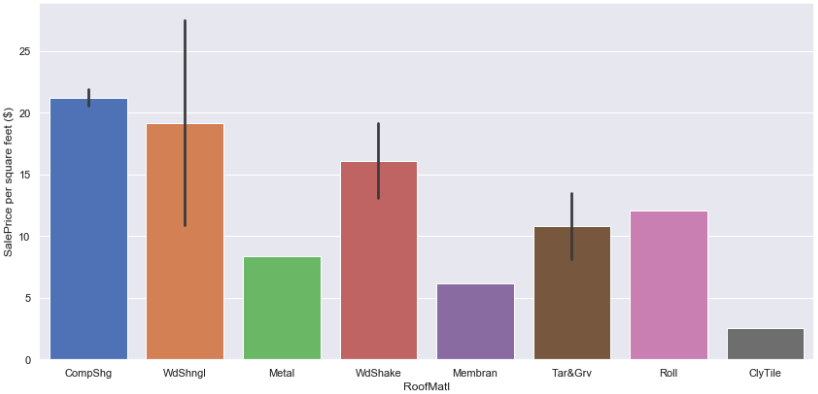
Considering the insulation, drainage, material cost and robustness, the lot with Standard (Composite) Shingle roof or Wood Shingles roof is more expensive than others. However, if a lot’s roof is constructed by Clay or Tile, it’s the relatively cheap (per square feet) since its function is not as well as others.
“SalePrice_per_squareFeet” vs. “Heating”
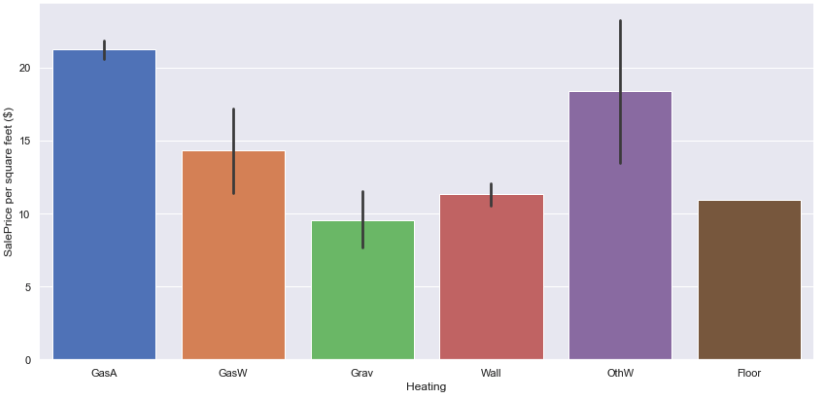
Considering material cost and construction-difficulties, the lot with “Gas forced warm air furnace” heating is more expensive than other heating types.
“SalePrice_per_squareFeet” vs. “GarageType”
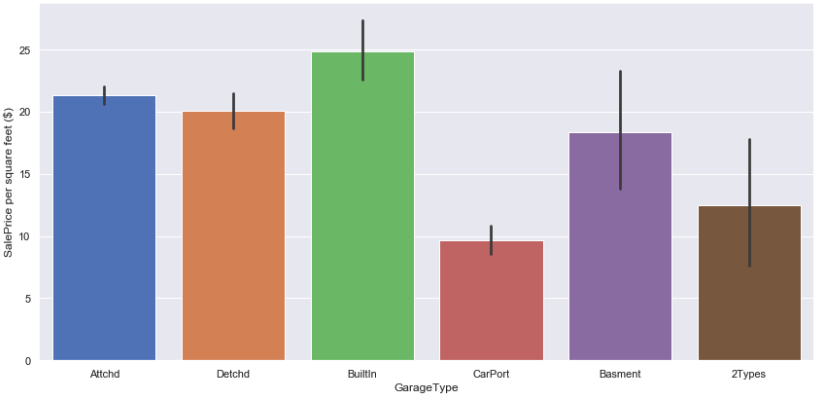
Considering construction and property’s convenience, the lot with built-in garage is more expensive than other types of garage, the lot only with car port as the garage is the cheapest in terms of per square feet’s price.
“SalePrice_per_squareFeet” vs. “SaleType”
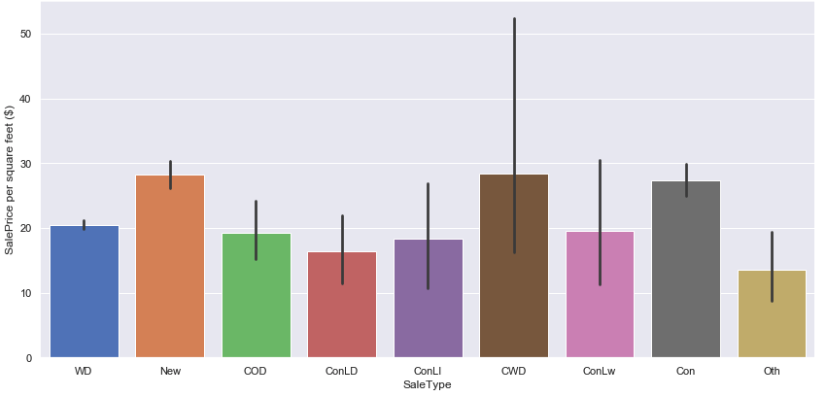
Let’s talk about the impact of sale type on the sale price. There is no doubt that the new lot which is just constructed and sold is the most expensive because its loss is the least. But I’m not clear for the reason of why other types of sale are less expensive. If you know why, your ideas are welcome :)
“SalePrice_per_squareFeet” vs. “SaleCondition”
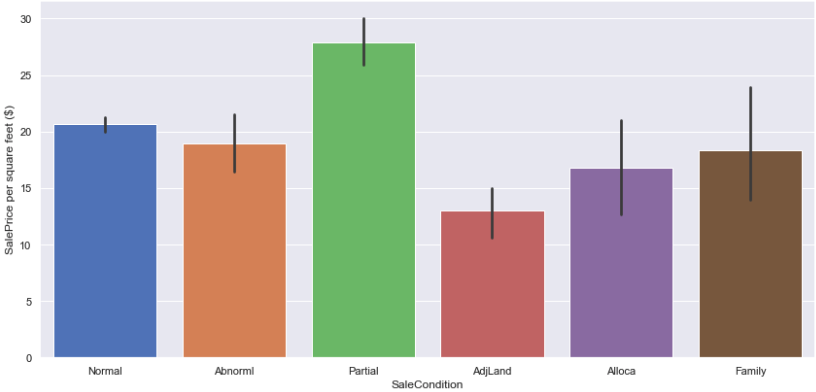
Among all sold lots, a lot is more expensive than others if it was not completed when last assessed (associated with New Homes), but it’s less expensive for the adjoining land purchase.
Train models
I trained data with Linear Regression, Ridge Regression, Lasso Regression and Elastic Net (with and without with cross-validation), also SVR, Gradient Boosting Regressor, XGBoost Regressor, and compared their accuracy score.
Finally I chose XGBoost Regressor to predict house prices in test dataset.
You can find all codes in this notebook.
Reference
- Kaggle Competition: Titanic: Machine Learning from Disaster
- Stacked Regressions to predict House Prices
- nattanan23, “Money home coin investment”, pixabay.com. [Online]. Available: https://pixabay.com/photos/money-home-coin-investment-2724235/