A map can clearly present information in terms of geography. Recently I learnt
how to draw public transport lines with folium module in Python. In this blog,
I will talk about how to do that with the following points:
- Datasets
- Draw transport lines with “folium”
Datasets
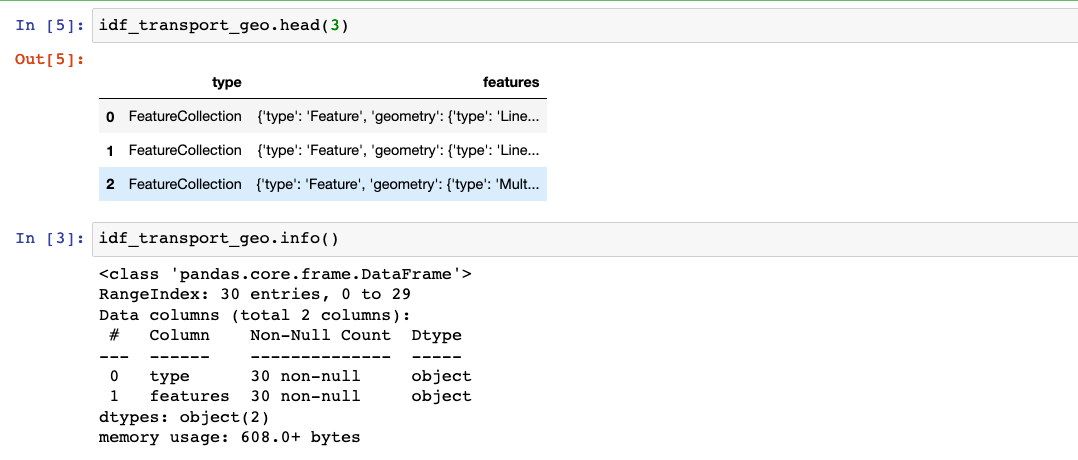
Before drawing maps, I’ll talk about the datasets which are used for this blog. I downloaded Île-de-France public transport network datasets.
import pandas as pd

idf_transport_geo = pd.read_json('data/transport/idf_ligne-transport.geojson')
idf_station_df = pd.read_csv('data/transport/idf-emplacement-des-gares.csv', sep=';', decimal='.')
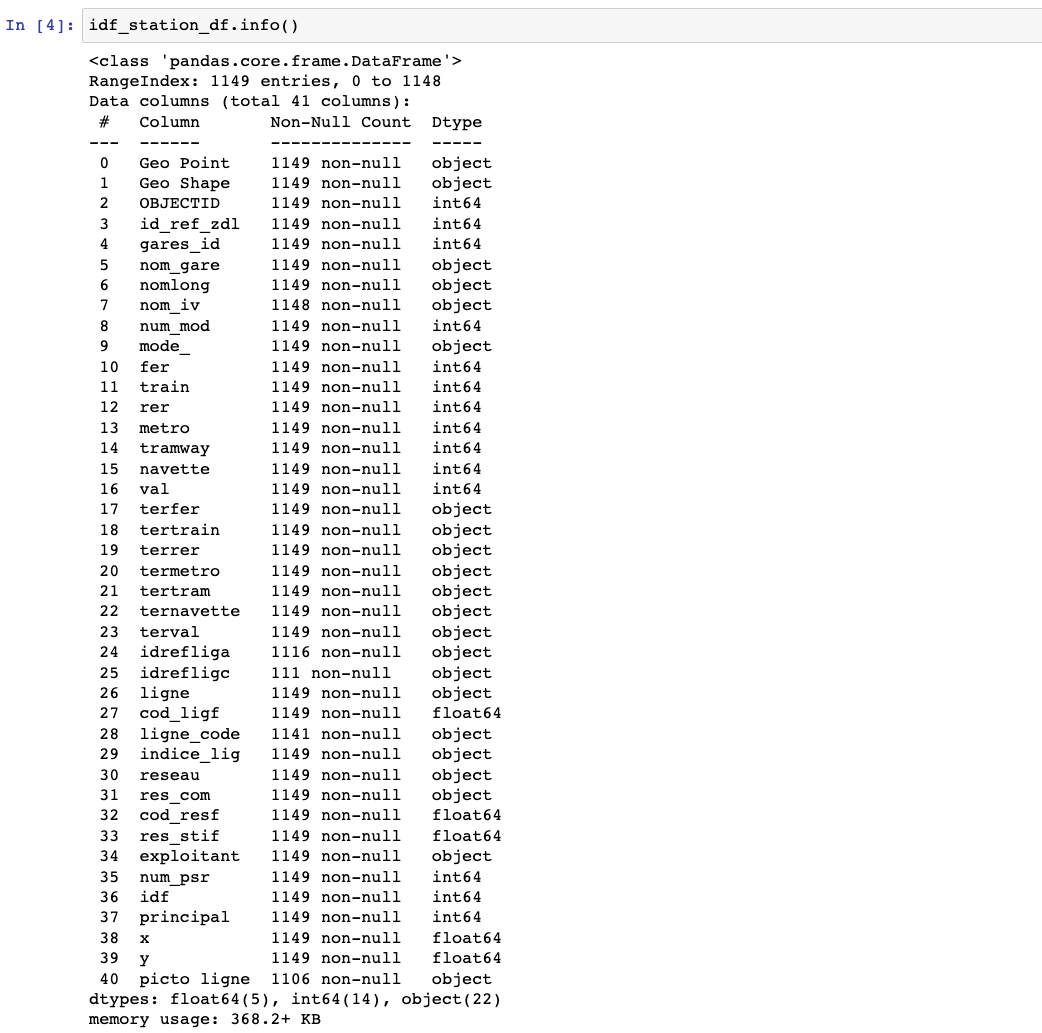
idf_station_df['lat'], idf_station_df['lng'] = zip(*idf_station_df['Geo Point'].apply(lambda x: x.split(',')))
idf_station_df['lat'] = idf_station_df['lat'].astype(float)
idf_station_df['lng'] = idf_station_df['lng'].astype(float)
idf_station_df = idf_station_df[idf_station_df['mode_'].isin(['Metro', 'RER'])]
To get stations’ coordinates (latitude, longitude), we split the Geo Point by
,, convert the values to float, and filter only the subway and RER(Réseau
Express Régional, English: Regional Express Network).
Draw transport lines with “folium”
import folium
idf_map = folium.Map(location=[48.868, 2.365], zoom_start=12, tiles='Cartodb dark_matter')
for line_segment in idf_transport_geo['features']:
gjson = folium.features.GeoJson(line_segment['geometry'],
style_function = lambda x: {'color': '#00C4B3',
'weight': 1.5})
idf_map.add_child(gjson)
for i, v in idf_station_df.iterrows():
folium.CircleMarker(location=[v['lat'], v['lng']],
radius=1.2,
color='#00C4B3',
fill_color='#00C4B3',
fill=True).add_to(idf_map)
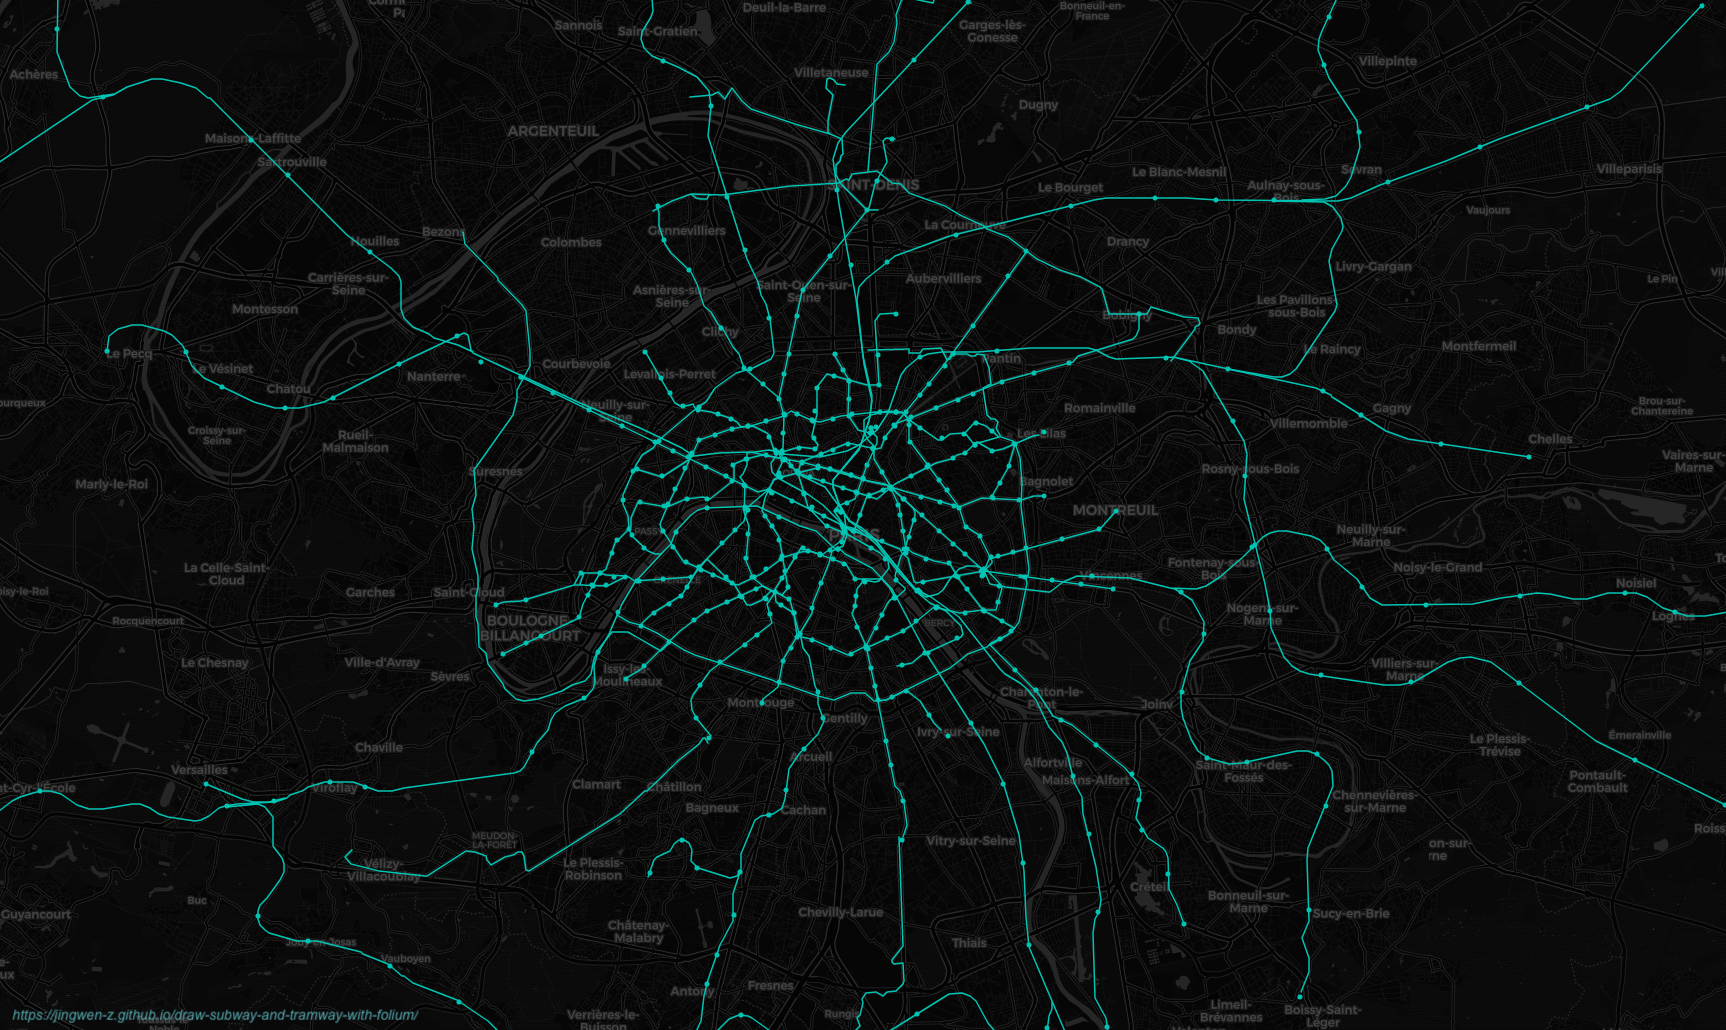
idf_mapI applied geometry which belongs to idf_transport_geo['features'] with
folium.features.GeoJson to draw the transport lines, and add station points
with folium.CircleMarker, then we get the following map.
Easter egg
I also visualise transport lines of many other cities:
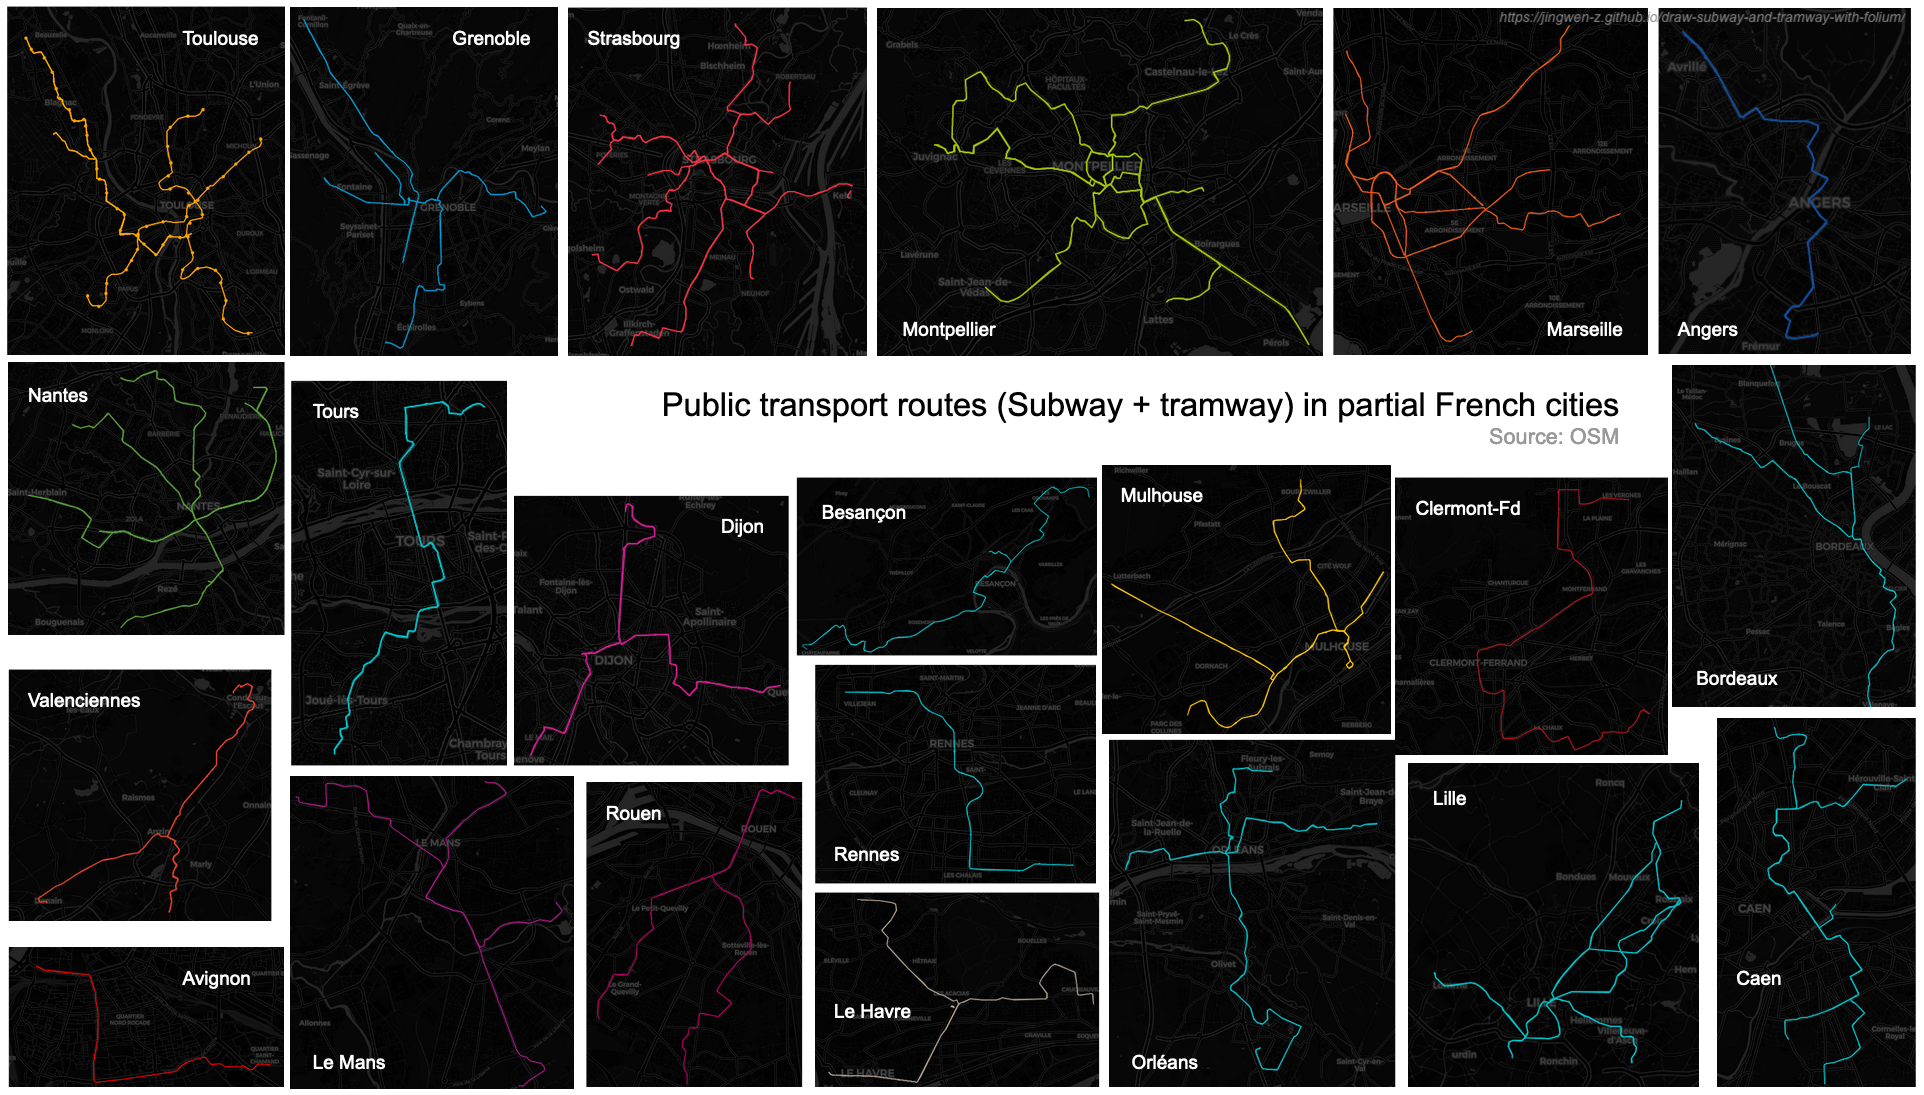
If you are curious about the scripts, you will find them here.
Reference
- “Gares et stations du réseau ferré d’Île-de-France (par ligne)”, data.iledefrance-mobilites.fr. [Online]. Available: https://data.iledefrance-mobilites.fr/explore/dataset/emplacement-des-gares-idf/information/?location=16,48.85089,2.51991&basemap=jawg.streets
- “Stations de métro (Toulouse)”, data.toulouse-metropole.fr. [Online]. Available: https://data.toulouse-metropole.fr/explore/dataset/stations-de-metro/map/?location=16,43.60215,1.44379&basemap=jawg.streets
- “Itinéraires de métro dans OpenStreetMap”, www.data.gouv.fr. [Online]. Available: https://www.data.gouv.fr/fr/datasets/itineraires-de-metro-dans-openstreetmap/
- “Itinéraires de tramways dans OpenStreetMap”, www.data.gouv.fr. [Online]. Available: https://www.data.gouv.fr/fr/datasets/itineraires-de-tramways-dans-openstreetmap/
- “Using GeoPandas to convert Linestring UTM data to LatLong”, gis.stackexchange.com. [Online]. Available: https://gis.stackexchange.com/questions/351846/using-geopandas-to-convert-linestring-utm-data-to-latlong
- “Converting UTM to Lat/Long with a geoJSON file in pyproj”, gis.stackexchange.com. [Online]. Available: https://gis.stackexchange.com/questions/217012/converting-utm-to-lat-long-with-a-geojson-file-in-pyproj
- “Converting projected coordinates to lat/lon using Python?”, gis.stackexchange.com. [Online]. Available: https://gis.stackexchange.com/questions/78838/converting-projected-coordinates-to-lat-lon-using-python
- pyproj4, “pyproj4 / pyproj”, github.com. [Online]. Available: https://github.com/pyproj4/pyproj
- Turbo87, “Turbo87 / utm”, github.com. [Online]. Available: https://github.com/Turbo87/utm
- “Universal Transverse Mercator coordinate system”, en.wikipedia.org. [Online]. Available: https://en.wikipedia.org/wiki/Universal_Transverse_Mercator_coordinate_system#From_UTM_coordinates_(E,N,_Zone,_Hemi)_to_latitude,_longitude(%CF%86,_%CE%BB)
- SplitShire, “metro subway rails railroad tracks”, pixabay.com. [Online]. Available: https://pixabay.com/photos/metro-subway-rails-railroad-tracks-407204/