At the same time of last month, China reached its peak of COVID-19 pandemic for the first stage. After March, the COVID-19’s proliferation spread to other countries around the world, especially in Europe and North America. In this blog, I will talk about the worldwide COVID-19 pandemic in the following points:
- COVID-19 pandemic in China
- Worldwide confirmed cases
- Daily cumulative confirmed count for each country
- COVID-19 pandemic spreads of TOP 10 countries
COVID-19 pandemic in China
Since around 20 February, the confirmed cases started to be stable in China, daily cured count started to be greater than daily new cases in all provinces.
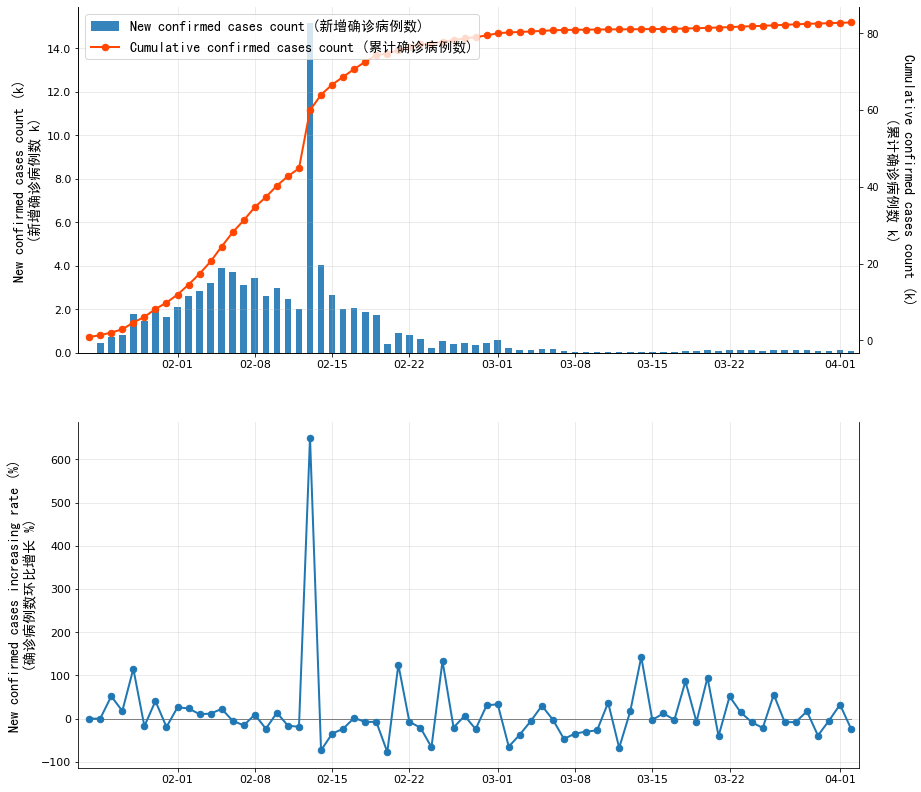
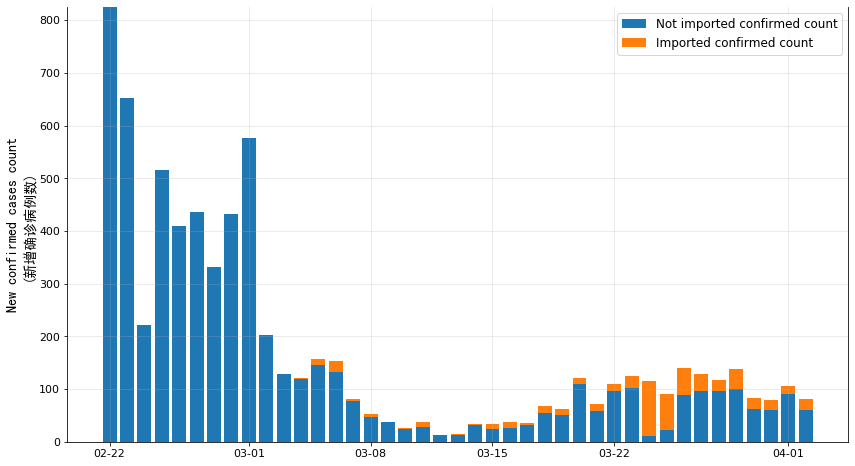
We can say the peak for the first stage has reached at the late of February, the daily increasing cases have reached its low point at 12 March which has 12 new cases. Then the daily new cases started to increase, there are various reasons, such as people returned to their workplaces so that the traffic or passengers started to increase in public places; moreover, lots of people who study or work abroad back to China, they were infected on their way to China.
Worldwide confirmed cases
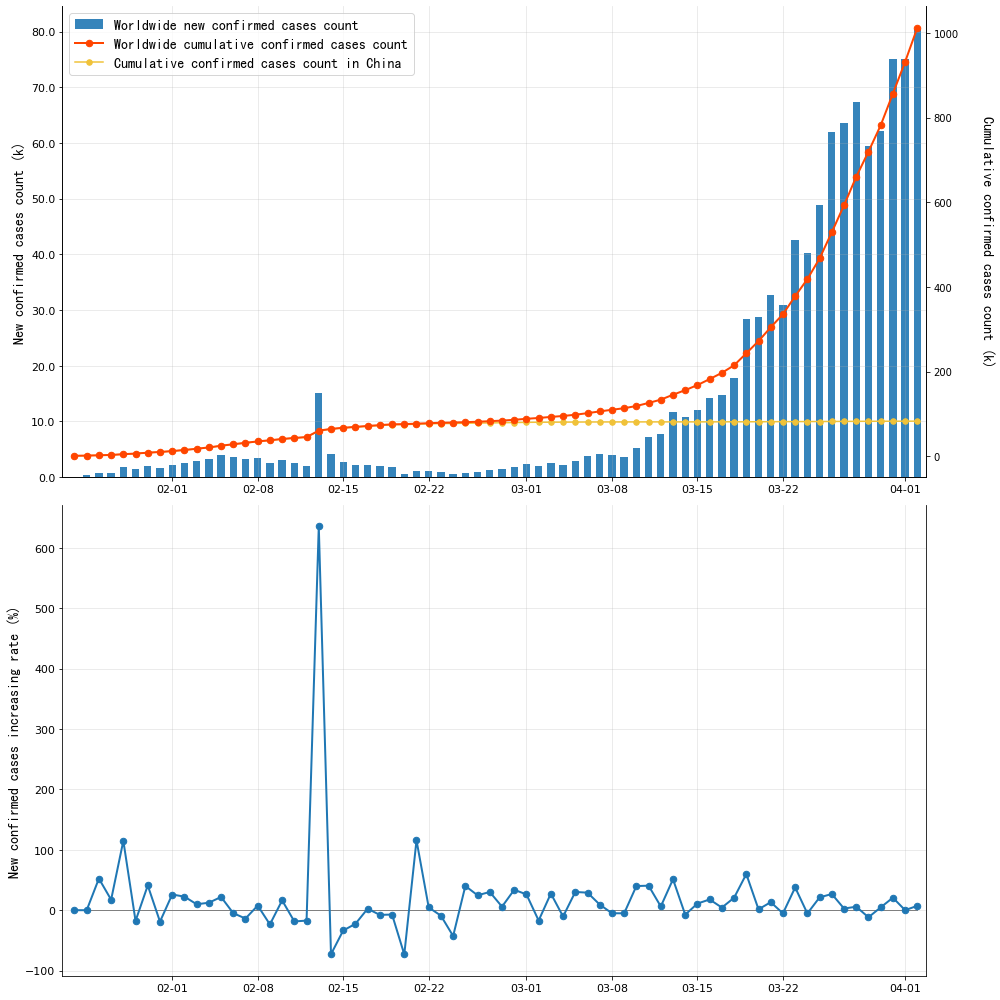
According to this graph, we find that since around 22 February, COVID-19 in China began to be stable, but it propagates in the Rest of World. As of 2 April, there were 1012360 cases of COVID-19, an increase of 80484 cases from the previous day. The new confirmed evolution per day is about 40% for the whole world.
Daily cumulative confirmed count for each country
COVID-19 pandemic spreads of TOP 10 countries
Cumulative number of confirmed cases, by number of days since 30th case
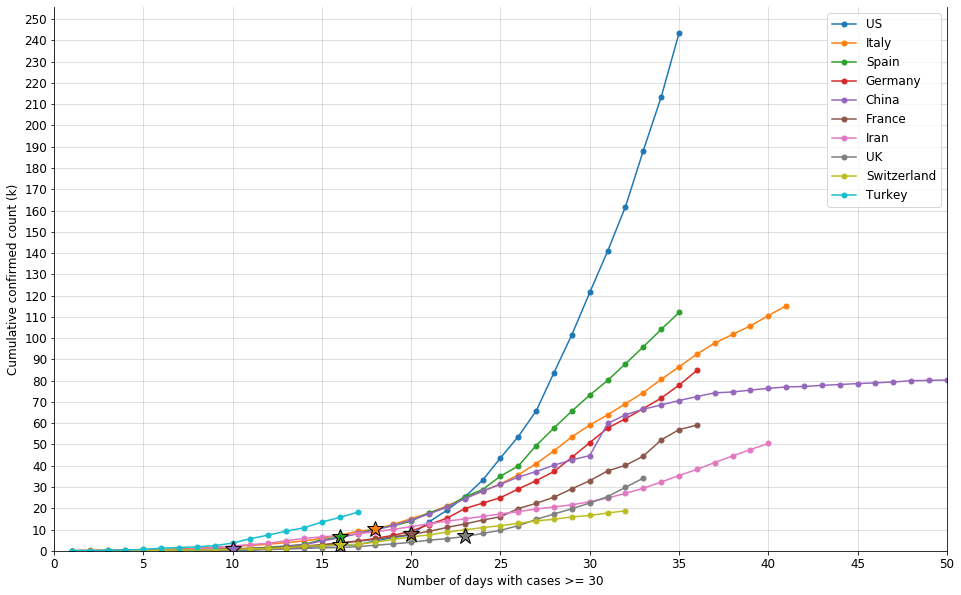
This plot describes the daily cumulative confirmed count for each country since the confirmed count arrived at 30 cases, the star stands for the day of lockdown. Here we need to highlight some countries:
- US: as of 2 April (UTC+02:00), US has 243453 cases, it exceeded all other top 9 countries since the 24th day after the 30th cases and soared without stopping. The average daily increase 15% for the last 3 days.
- Italy: as of 2 April (UTC+02:00), Italy has 115242 cases. Although it’s the second highest country, Italy has the trend of improvement, the average daily increasing has dropped to 4.2% for the last 3 days, versus 5.6% for between last 6 and 4 days.
- Spain: as of 2 April (UTC+02:00), Spain has 112065 cases, which is greater than other 9 countries except US for the same day number, it might exceed Italy tomorrow. However, the improvement seems to appear, the average daily increasing arrived 8.4% for the last 3 days.
- Germany: as of 2 April (UTC+02:00), Germany has 84794 cases, the average daily increasing arrived 8.2% for the last 3 days.
- China: as of 2 April (UTC+02:00), China has 82771 cases, the average daily increasing arrived 0.12% for the last 5 days.
- France: as of 2 April (UTC+02:00), France has 59105 cases, the average daily increasing arrived 10% for the last 3 days.
- Iran: as of 2 April (UTC+02:00), Iran has 50468 cases, the average daily increasing arrived 6.7% for the last 3 days.
- UK: as of 2 April (UTC+02:00), UK has 34173 cases, the average daily increasing arrived 15% for the last 3 days. The 31st day after the 30th cases, UK’s confirmed cases exceeded Iran for the same day number.
- Switzerland: as of 2 April (UTC+02:00), Switzerland has 18827 cases, the average daily increasing arrived 5.8% for the last 3 days.
- Turkey: as of 2 April (UTC+02:00), Turkey has 18135 cases, the average daily increasing arrived 19% for the last 3 days, which is even higher than the US. Moreover, what we need to attention is Turkey’s confirmed cases is greater than all other 9 countries for the same day number.
Cumulative number of confirmed cases per 1 million people, by number of days since 30th case
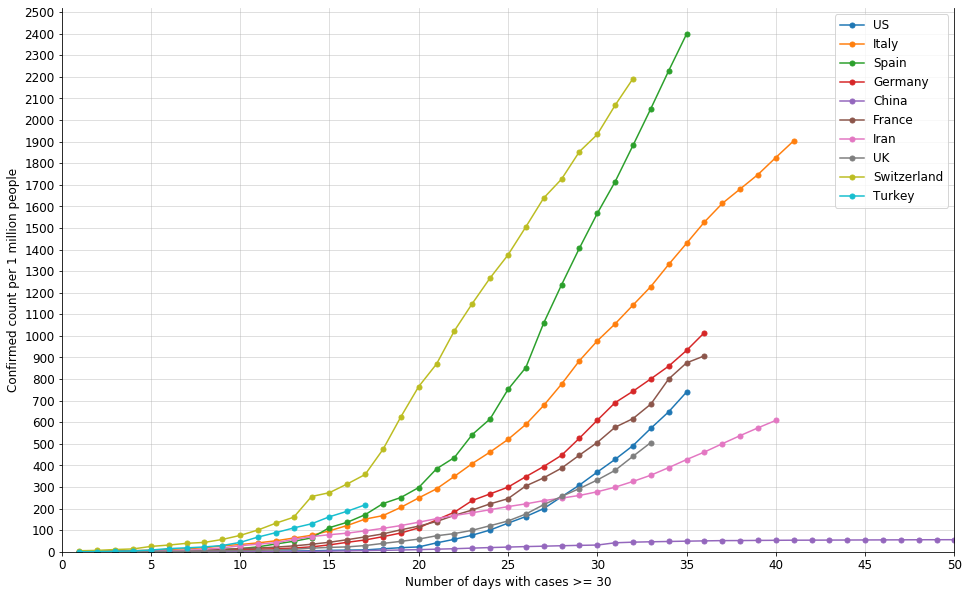
This plot describes the daily cumulative confirmed count per 1 million people for each country since the confirmed count arrived at 30 cases. Here we need to highlight some countries:
- Spain: its confirmed count per 1 million people is the highest among the top 10 countries, which is 2400 cases.
- Switzerland: its confirmed count per 1 million people is a less than Spain, but it’s the highest among these 10 countries for the same day number, though its confirmed count is much less than others.
- China: started being stable since the 30th day after 30 cases.
- US: on the 29th day after the 30th cases, its confirmed count per 1 million people exceeded UK and Iran, and even trends to be higher than France and Germany.
Cumulative deaths rate, by number of days since 20 deaths
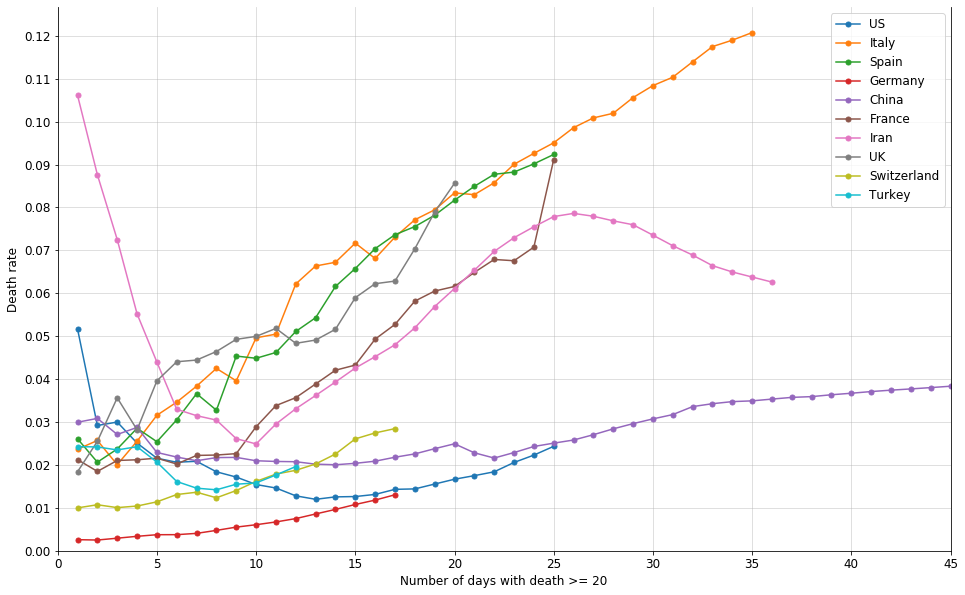
This plot describes the daily cumulative deaths rate for each country since the deaths arrived at 20 cases. Here we need to highlight some countries:
- Italy: highest deaths rate among 10 countries, continuous increasing from the beginning.
- Spain: its deaths rate follows the trend of Italy, continuous increasing from the beginning.
- UK: continuous increasing from the beginning, on the 20th day after the 20th deaths, UK’s deaths rate is greater than Italy and Spain for the same number of day.
- Germany: continuous increasing slowing, it’s the lowest deaths rate among the 10 countries.
- France: its deaths rate was around 2% at the beginning, increases from the 10th day after the 20th deaths, 2% increased only during yesterday. The deaths rate arrived at 9%, which is nearly the same as Spain.
- US: on the 25th day after the 20th deaths, US’s deaths rate is nearly the same as China for the same day number.
Reference
- Isaac Lin, “DXY-COVID-19-Data”, www.github.com. [Online]. Available: https://github.com/BlankerL/DXY-COVID-19-Data
- CSSEGISandData, “csse_covid_19data”, _www.github.com. [Online]. Available: https://github.com/CSSEGISandData/COVID-19/tree/master/csse_covid_19_data/csse_covid_19_daily_reports
- geralt, “virus coronavirus covid-19 pandemic”, pixabay.com. [Online]. Available: https://pixabay.com/illustrations/virus-coronavirus-covid-19-pandemic-5675422/