In recent work, I transformed data with pyspark. Since I often did this with
pandas in my previous work, I will compare these two packages on data
transformation with the following points:
- Checking dataframe size
- Checking unique values of a column
- Creating a new column
- Filtering
- Selecting a list of columns
- Aggregating
- Rename column
- Joining 2 dataframes
- Creating a new dataframe
- Creating a pivot table
Packages
import pandas as pd

import pyspark
from pyspark.sql import SparkSession
from pyspark.sql import functions as F
Data
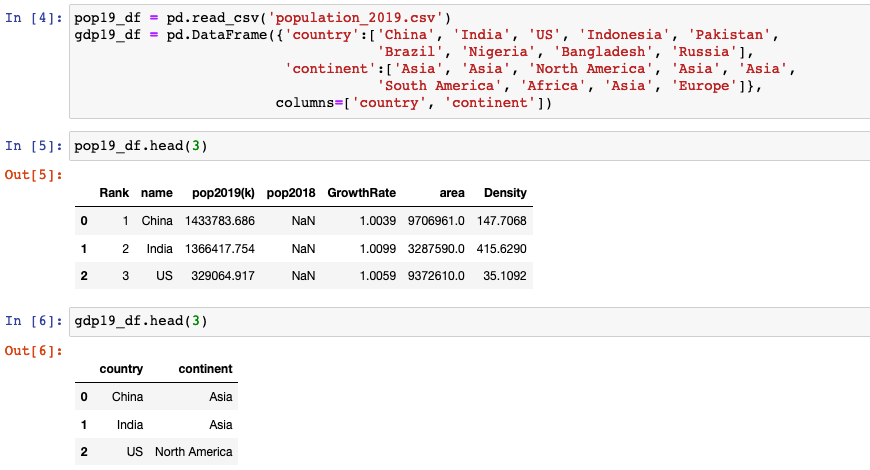
pyspark vs. pandas
Checking dataframe size

.count()counts the number of rows in pyspark.pandas.DataFrame.shapereturns a tuple representing the dimensionality of the DataFrame.
Checking unique values of a column
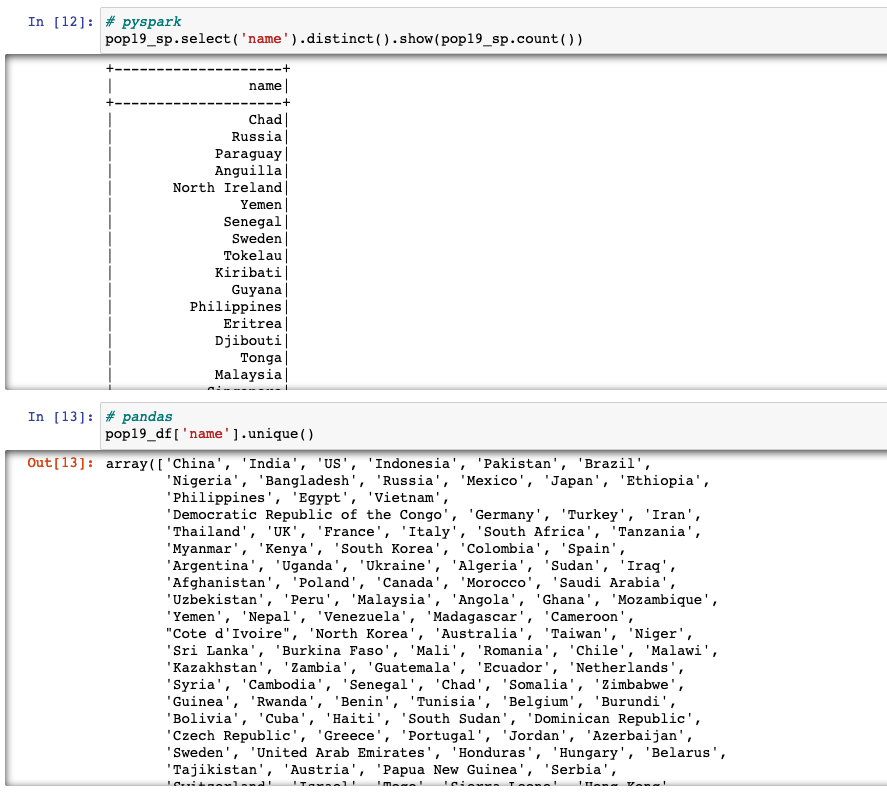
.select().distinct(): distinct value of the column in pyspark is obtained by usingselect()function along withdistinct()function.select()takes up the column name as argument, followed bydistinct()will give distinct value of the column.pandas.unique(): uniques are returned in order of appearance.
Creating a new column

withColumn(colName, col)returns a new dataframe by adding a column or replacing the existing column that has the same name.
Filtering
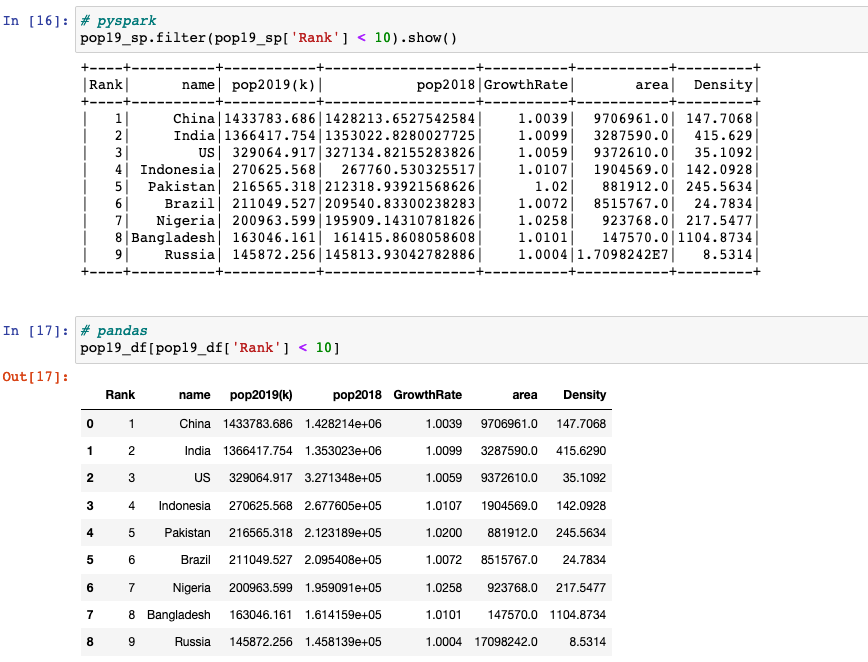
filter(condition)filters rows using the given condition.- We can apply
df[condition]to get only the rows that satisfy the condition.
Selecting a list of columns
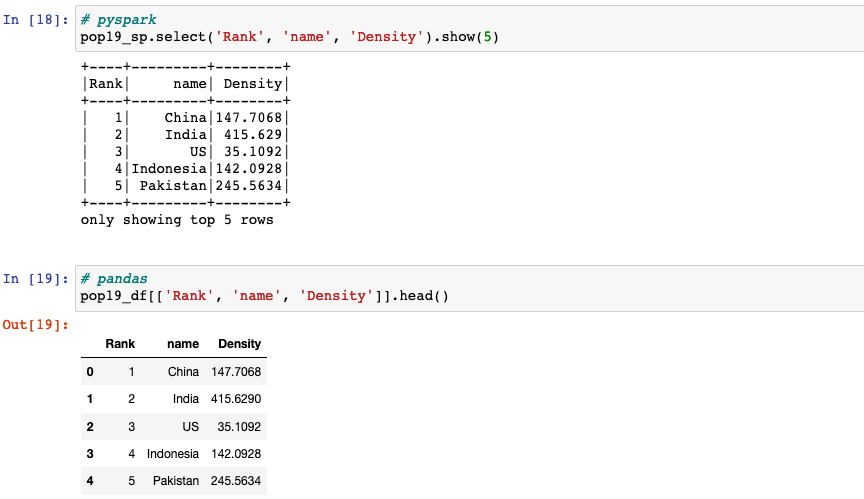
select(*cols)projects a set of expressions and returns a new DataFrame.[[*cols]]: we can pass a list of columns to [] to select columns in that order.
Aggregating

agg(*exprs): aggregates on the entire dataframe without groups (shorthand fordf.groupBy.agg()).
Renaming columns
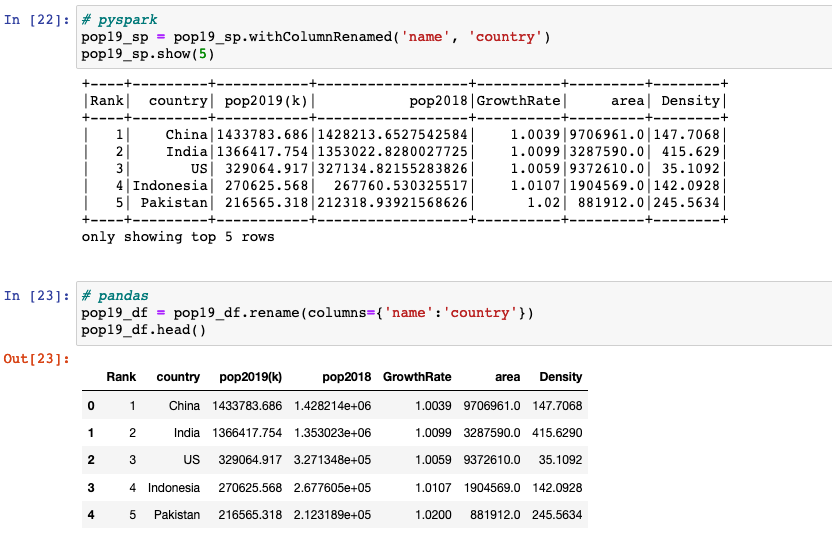
withColumnRenamed(existing, new)returns a new DataFrame by renaming an existing column. This is a no-op if the schema doesn’t contain the given column name.DataFrame.rename(**kwargs)alters axes labels.
Joining 2 dataframes
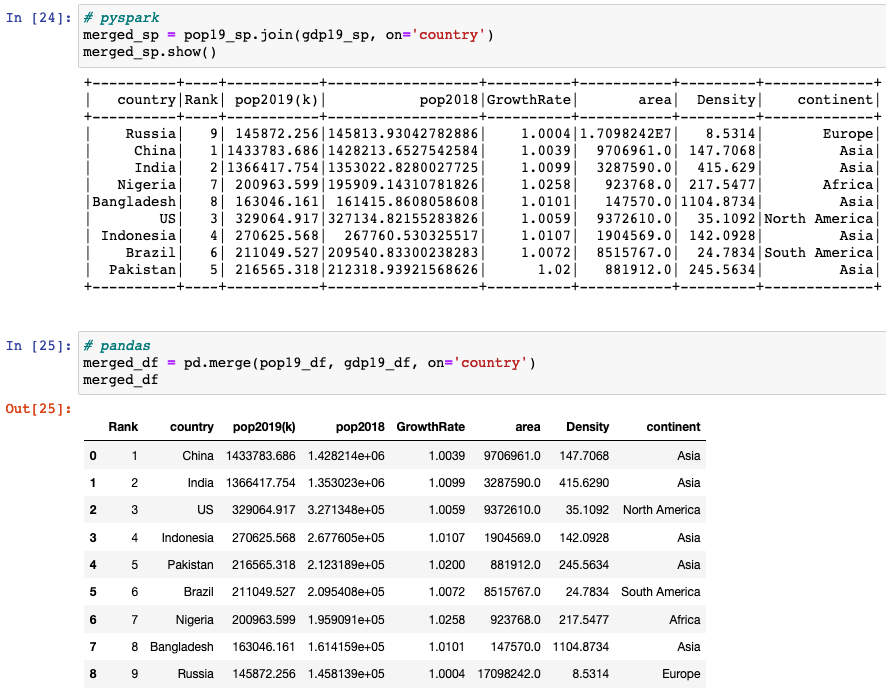
join(other, on=None, how=None)joins with another DataFrame, using the given join expression.DataFrame.merge(): merges DataFrame or named Series objects with a database-style join.
Creating a new dataframe
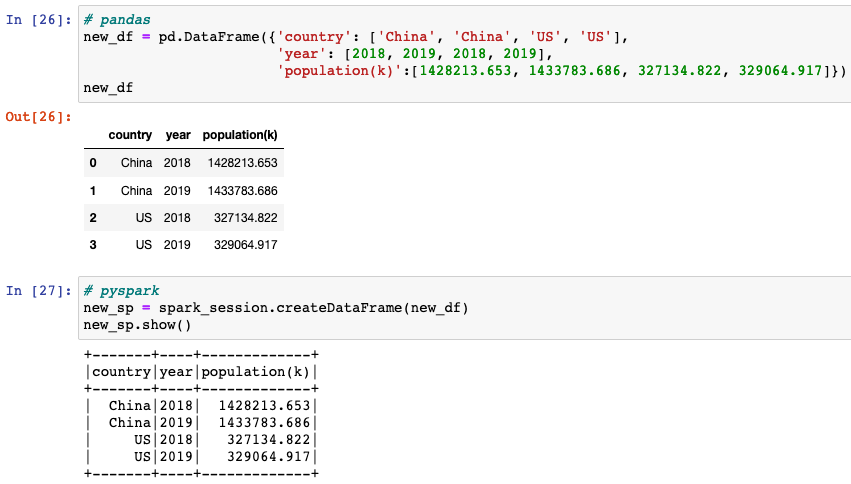
pandas.DataFrame()creates two-dimensional, size-mutable, potentially heterogeneous tabular data.createDataFrame()creates a dataframe from an RDD, a list or apandas.DataFrame.
Creating a pivot table
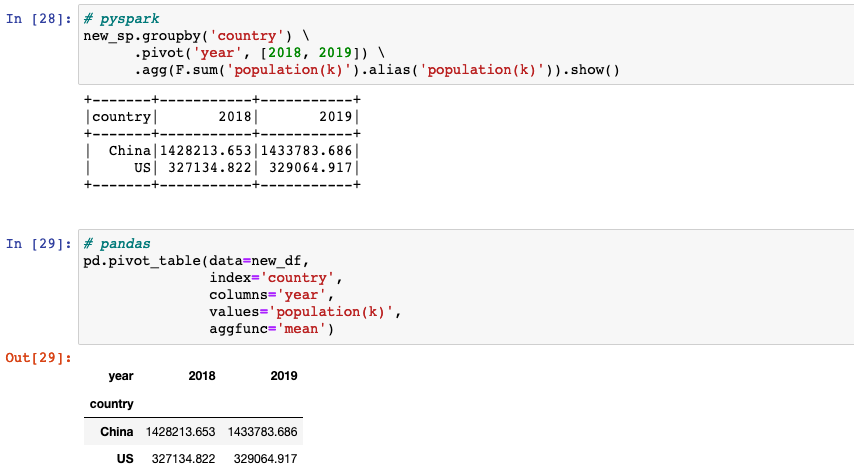
pivot(pivot_col, values=None): pivots a column of the current DataFrame and perform the specified aggregation.DataFrame.pivot_table()creates a spreadsheet-style pivot table as a dataframe.
Reference
- “DataScience Made Simple”, datasciencemadesimple.com. [Online]. Available: https://www.datasciencemadesimple.com/
- “pandas”, pandas.pydata.org. [Online]. Available: https://pandas.pydata.org/pandas-docs/stable/index.html
- “pyspark”, spark.apache.org. [Online]. Available: https://spark.apache.org/docs/latest/api/python/index.html
- mordilla-net, “mammal animal world cute animal”, pixabay.com. [Online]. Available: https://pixabay.com/photos/mammal-animal-world-cute-animal-3162194/